
TRANSPORTATION MONITORING REPORT - PHASE 1
Report to/Rapport au :
Transportation Committee
Comité des transports
10 April 2006 / le 10 avril 2006
Submitted by/Soumis par : Ned Lathrop, Deputy City Manager/Directeur municipal adjoint,
Planning and Growth Management/Urbanisme et Gestion de la croissance
Contact Person/Personne ressource : Mohammad Tayyaran, Project Manager
Planning, Environment and Infrastructure Policy/Politiques d’urbanisme, d’environnement et d’infrastructure
(613) 580-2424 x 28540, mohammad.tayyaran@ottawa.ca
SUBJECT: | |
| |
OBJET : |
REPORT RECOMMENDATION
That the Transportation Committee receive this report for information.
RECOMMANDATION DU RAPPORT
Que le Comité des transports prenne connaissance du présent rapport à titre d’information.
EXECUTIVE SUMMARY
Assumptions and Analysis:
The City of Ottawa’s Transportation Master Plan (TMP) recommended a framework of transportation performance measurement to enable ongoing monitoring of its progress towards achieving the goals and objectives identified in the Plan.
A review of each of the transportation objectives and availability of data to quantify and measure progress using the identified indicators was carried out in late 2004. 31 out of a total 48 indicators were identified for immediate measurement (Phase I) based on data availability, which addressed ten of the eleven objective areas identified in the Plan.
The following observations are made on some of the main transportation indicators:
Indicator | Performance |
Auto Occupancy | The trend observed over the past ten years confirms a downward trend in the numbers of occupants per vehicle. Currently, the average auto occupancy is around 1.2. The average auto occupancy observed in Ottawa, while declining, is similar to that of many of major Canadian cities observed at approximately 1.2 persons per vehicle. |
Transit Ridership | Annual transit ridership has been increasing in recent years. It reached approximately 89 million in 2004 recovering from a low of 65 million riders in 1996. Per capita transit ridership during the same period has also increased steadily and has stabilized somewhat at approximately 120 rides per capita. Compared to other cities in North America with service area populations below 1 million, Ottawa has the highest transit rides per capita. This figure for Calgary is 69, for Edmonton is 67, for Winnipeg is 62, and for Portland, Oregon is 71. |
Transit Modal Split | Most corridors are recording increases in transit modal split. It is expected that implementation of new rapid transit infrastructure will further increase transit modal split. |
Cycling Modal Share | The observed cycling mode share in the inner area reflects a drop in the modal share from a high of around 2.4% of all trips in 1996 to the current level of approximately 1.9%. |
Walking Modal Share | The walking mode share shows a level of variation over time, however the trend line over the past ten years is positive and suggests current walk shares in downtown are approximately 12% of total trips for the afternoon peak period. |
The number of low floor buses in OC Transpo’s bus fleet has increased substantially in recent years rising from 110 in 1999 to approximately 454 in 2004, representing 51% of the active bus fleet. The City’s objective is to have a fully accessible transit fleet by 2015. | |
Both the morning and afternoon commuter peak period traffic represent slightly more than 50% of trips occurring between 7:00 am to 7:00 pm. This ratio has been relatively constant over the past ten years suggesting that peaking characteristics have remained unchanged. | |
Peak Spreading of Transit Demand | The proportion of transit riders using the transit system during the peak commuter periods has fallen slightly over the past ten years indicating that larger segments of the daily ridership growth have been attracted to the off-peak time periods. Current ridership profiles indicate that about 57% of the daily ridership occurs during the two peak periods compared to 59% in 1995. |
In general, while many key transportation indicators related to walking, transit and automobile growth are moving in the right direction towards stated TMP targets, a few such as cycling and auto occupancy are moving away. However, despite the downward trend, Ottawa still performs very well in terms of these two indicators in comparison to all other major Canadian cities.
Financial Implications:
There are no financial implications as a result of this report.
Public Consultation/Input:
No public consultation took place in the development of this report. The objectives and performance measurement indicators were defined as part of the development of the TMP, which entailed significant public consultation.
RÉSUMÉ
Hypothèses et analyse :
Le Plan directeur des transports (PDT) de la Ville d’Ottawa recommandait la mise en œuvre d’un cadre de mesure du rendement des transports pour ainsi permettre la surveillance continue des progrès à l’égard de la réalisation des objectifs et des buts indiqués dans le Plan.
Un examen de chacun des objectifs en matière de transport et de la disponibilité des données visant à quantifier et à mesurer les progrès réalisés à l’aide des indicateurs indiqués a été effectué à la fin de 2004. Des 48 indicateurs présentés, 31 ont été identifiés comme la prise immédiate de mesures (Phase I) en raison de la disponibilité des données portant sur dix des onze objectifs indiqués dans le Plan.
Les observations suivantes sont présentées sur certains des indicateurs principaux :
Indicateur | Rendement |
Taux d’occupation des automobiles | La tendance observée ces dix dernières années confirme une baisse du nombre de personnes par véhicule. À l’heure actuelle, le taux d’occupation moyen des véhicules automobiles se situe environ à 1,2. Le taux d’occupation moyen des véhicules automobiles à Ottawa, bien qu’il soit en déclin, est similaire à celui de plusieurs grandes villes canadiennes, soit environ 1,2 personne par véhicule. |
Taux d’achalandage | Le taux d’achalandage annuel a augmenté ces dernières années et a ainsi atteint 89 millions en 2004, en hausse par rapport au plus bas niveau de 65 millions d’usagers qu’il avait atteint en 1996. Pendant la même période, le taux d’achalandage du transport en commun par résident a aussi augmenté de façon constante pour se stabiliser à environ 120 déplacements par résident. Si on le compare à d’autres villes de l’Amérique du Nord ayant une population inférieure à 1 million dans le terrtoire des servi, Ottawa enregistre le taux d’utilisation du transport en commun par résident le plus élevé. Ainsi, il se situe à 69 pour Calgary, à 67 pour Edmonton, à 62 pour Winnipeg et à 71 pour Portland, en Oregon. |
Répartition modale du transport en commun | La majorité des corridors ont enregistré des hausses dans la répartition modale. On s’attend à ce que la mise en œuvre d’une nouvelle infrastructure de transport en commun rapide permette d’augmenter encore cette répartition. |
Part modale du cyclisme | La part modale du cyclisme observée dans la zone intérieure reflète une chute de la répartition modale après un pic d’environ 2,4 % de tous les déplacements effectués en 1996 jusqu’au niveau actuel d’environ 1,9 %. |
Part modale de la marche | Avec le temps, la part modale de la marche montre des variantes. Cependant, la tendance des dix dernières années est positive et suggère que la marche représente environ 12 % de l’ensemble des déplacements effectués au centre-ville, pendant la période de pointe de l’après-midi. |
Le nombre d’autobus à plancher surbaissé dans le parc de véhicules de transport en commun d’OC Transpo a grandement augmenté ces dernières années, passant de 110 en 1999 à environ 454 en 2004, soit 51 % du parc actif. La Ville a pour objectif d’avoir un parc de véhicules de transport en commun entièrement accessible d’ici 2015. | |
Les périodes de pointe du matin et de l’après-midi représentent un peu plus de 50 % des déplacements effectués entre 7 h et 19 h. Ce rapport a été relativement constant ces dix dernières années, ce qui indique que les caractéristiques de la période de pointe demeurent inchangées. | |
Étaler la demande en période de pointe - transport en commun | La proportion des usagers du transport en commun qui utilisent le réseau de transport en commun pendant les périodes de pointe a légèrement diminué ces dix dernières années, ce qui indique que de plus grands segments de croissance des usagers quotidiens se sont déplacés vers les périodes hors pointe. Les profils des usagers actuels indiquent qu’environ 57 % de l’utilisation quotidienne se fait pendant les deux périodes de pointe alors qu’elle était de 59 % en 1995. |
En général, bien que bon nombre d’indicateurs clés en matière de transport liés à la croissance de la marche, à l’utilisation du transport en commun et aux véhicules automobiles aillent dans la bonne direction pour ainsi permettre d’atteindre les objectifs indiqués dans le PDT, quelques-uns, comme le cyclisme et l’utilisation des véhicules, s'en éloignent. Cependant, en dépit de cette tendance à la baisse, Ottawa obtient toujours de bons résultats à l'égard de ces deux indicateurs par rapport à toutes les autres grandes villes canadiennes.
Répercussions financières :
Aucune répercussion financière ne découle de ce rapport.
Consultation publique / commentaires :
La rédaction de ce rapport n’a exigé aucune consultation publique. Les objectifs et indicateurs de mesure du rendement ont été définis dans le cadre de l'élaboration du PDT qui, en revanche, a exigé une vaste consultation publique.
BACKGROUND
The City of Ottawa’s Transportation Master Plan (TMP) recommended a framework of transportation performance measurement to enable ongoing monitoring of its progress towards achieving the goals and objectives identified in the Plan. The framework identified eleven primary transportation objectives along with a number of sub-objectives with specific indicators to measure progress:
§ Limit motor vehicle traffic growth § Increase transit use § Increase cycling § Increase walking § Reduce unwanted social and environmental effects § Optimize use of existing system | § Manage transportation assets § Improve transportation safety § Enable efficient goods movement § Meet mobility needs of persons with disabilities § Meet public expectations |
The purpose of this report is to present the results of the ‘Transportation Monitoring’ effort. This and future reports will provide opportunities to report on the City’s accomplishments as well as opportunities to make adjustments as necessary to the City’s transportation priorities.
It is important to note that the performance measurement framework will evolve over time. Some City programs are currently developing new approaches to program-level performance measurement that could improve the framework presented in here.
DISCUSSION
A review of each of the transportation objectives identified in the TMP and availability of data to quantify and measure progress using the identified indicators was carried out in late 2004. 31 out of a total 48 indicators were identified for immediate measurement (Phase I) based on data availability, which addressed ten of the eleven objective areas noted above. The indicators associated with meeting public expectations objective was identified as requiring additional surveys to gauge the general public specific attitudes regarding transportation services and as such has not been included in this report.
Phase II of the Monitoring effort will address the issue of public expectations and other measurement indicators that have not been captured in this initial report.
It should be noted that while target values are provided for some indicators, in some instances there is no analytical basis to establish one, and in other cases the indicator in question is more descriptive and has no “ideal” value.
SUMMARY AND HIGHLIGHTS
A summary of indicators/objectives along with a general indication of their status and progress being achieved in meeting their planned stated objectives is presented in Table 1, followed by some of the main highlights of the report. Of the total of 31 indicators analysed in this report, 12 are on track with TMP objectives, 9 show no noticeable change, 4 are moving away from TMP targets, and 6 indicators require more monitoring data to establish trends.
The full Transportation Monitoring Report contains more detailed information and historical performance of the individual indicators (see Document 1). In most cases, historical performance trend is provided for a 10-year period.
In general, while many key transportation indicators related to walking, transit and automobile usage are moving in the right direction towards stated TMP targets, a few such as cycling and auto occupancy are moving away. However, despite the downward trend, Ottawa still performs very well in terms of these two indicators in comparison to all other major Canadian cities.
TABLE 1 - Summary of Transportation Objectives and Performance Indicators
Legend: Good On Track with TMP Objectives Fair No change occurring within indicator Poor Moving away from TMP targets ? More monitoring required to establish trend |
OBJECTIVE / INDICATOR | PERFORMANCE / COMMENT |
1. Limit motor vehicle traffic growth | |
(a) Reduce motor vehicle use per capita - Relative growth in automobile traffic volumes | Good Ratio of percentage growth in peak period traffic volumes to percentage population growth has a target of less than 1 over the planning period. In general, growth areas outside the Greenbelt show positive results with the trend across the ten-year period heading in the right direction. While Southeast area has shown slight increase in traffic-to-population ratio, it is still just under 1. |
(b) Increase Motor Vehicle Occupancy Rates - Auto occupancy rates (persons per vehicle) | Poor Vehicle occupancy rates during the peak travel periods, has a target of 1.3 or more by 2021. Morning and afternoon auto occupancies levels have fallen considerably in recent years. Based on these trends, achieving TMP targets by 2021 will be challenging requiring proactive measures. |
2. Increase transit use | |
(a) Increase transit Ridership per capita - Transit passenger volumes (rides per capita) - Transit Modal Split (% of motorized trips) | Good Transit ridership has increased steadily and has stabilized at approximately 120 rides per capita, recovering from losses during the mid 1990’s. Good Most corridors are recording increases in transit modal split, however higher rates of transit growth are needed to meet TMP targets. |
(b) Increase service availability - Proximity to employment (10 min service & employment location within 400m) - Service Level (service capacity-km per capita) | Good Existing Employment nodes are well served by transit. Approximately 85% of all jobs within the UTA are served by transit stops offering at least 10-min headway during peak periods. Good Service capacity-km per capita has risen steadily over recent years reflecting the steady growth in the population and the transit km travelled. Overall trend supports long-term growth. |
(c) Increase service speed and reliability - Intersection with transit signal priority (number) - Average vehicle speed (vehicle-km per veh-hr) - Cancelled trips (% of scheduled trips) | Good The number of intersections with transit signal priority has been consistently increasing over the past ten years reaching 45 sites indicating that locations requiring transit priorities are being addressed continually. Good Despite increased levels of roadways congestion the average network speed of transit has been relatively stable between 25 and 26 km per hour over the past ten years. Good Percentage of cancelled trips is low at approximately 0.6% of scheduled trips. |
(d) Increase User Comfort and Convenience - Shelter Provision (number) | Fair The percentage of bus stop locations with passenger shelters is at 18% in 2004. Additional shelters are needed. |
3. Increase cycling | |
(a) Increase cycling modal share - Cycling modal share (% of all trips) - Cycling Activity Index | Poor Cycling mode shares for the Inner Area Cordon have fallen in recent years, stabilizing at approximately 1.5 to 2% of all person trips. Results from the 2005 OD Survey will need to be examined for citywide modal share level. Poor Cycling Activity index indicates declining cycling use over the last 10 years reaching about 1.35 cyclists per 100 vehicles at observed intersections. |
(b) Increase availability of cycling facilities - Completion of Cycling Network (%) | ? Inventory of cycling network facilities has been established. Too early to establish trends. Cycling network coverage is at about 20% of total planned network. |
4. Increase walking | |
(a) Increase walk modal share - Walking modal share (% of all trips) | Good Central Business District walking mode share shows a level of variation over time, however the trend over the past ten years is positive, and in 2004 it is at 11.5%. Results from the 2005 OD Survey will need to be examined for citywide modal share level. |
(b) Increase availability of walking facilities - Sidewalk coverage | ? Inventory of walking facilities has been established. Too early to establish trends. Sidewalk coverage is at 21% in 2004. |
5. Reduce unwanted social and environmental effects | |
(a) Reduce road salt use - Road salt usage (tonnes) | ? Data are available for the last three years only. More time is required to establish trends – nevertheless short-term results are encouraging. |
(b) Road surface per capita - Road surface area (square metres per capita) | ? Inventory of road network has been established. Too early to establish trends. The road surface area per capita for 2004 is at 52 square meters |
6. Optimize use of existing system | |
(a) Increase capacity - Transportation system management coverage (% of signals with real-time optimization) | Fair While both the number of intersections under traffic signal control and signals with real-time optimization have increased over the past ten years, their ratio has remained relatively constant at around 84%. |
(b) Increase transit efficiency - Transit efficiency (pass-km per service capacity-km) | Fair Despite a slight fall in recent years, which is likely a result of changes in fleet composition (with more articulated buses), long-term trend suggests this indicator is relatively unchanged as both the number of passenger kilometres and bus capacity kilometres have been increasing steadily over the past ten years. |
(c) Spread peak travel demands – Roads - Peak period factors for roads (% of daily trips in am and pm peak periods) | Fair Percentage of daily trips in am and pm peak periods has remained relatively unchanged staying at around 50%. TMP objective is to spread demand (flatten peaks). |
(d) Spread peak travel demands – Transit - Peak period factors for transit (% of daily trips in am and pm peak periods) | Fair Percentage of daily trips in am and pm peak periods has shown some reduction in recent years suggesting that some peak flattening is occurring. TMP objective is to flatten peaks. |
7. Manage transportation assets | |
(a) Maintain adequate condition of transit fleet - Average vehicle age (years) | Good Recent trend emerging is positive and encouraging. Since 1997, the average fleet age has been decreasing, reaching an average of about 8 years in 2004 in line with the TMP target of 9 years. |
8. Improve transportation safety | |
(a) Reduce death and injury from collisions - Road injuries (number) - Road fatalities (number) | Good Longer-term trend is encouraging. The total number of persons injured annually has steadily declined to less than 4,200 in 2004. Fair The number of reported annual fatalities has remained relatively stable despite population growth. |
(b) Increase walking safety - Reported pedestrian collisions (number) | Fair The number of collisions involving pedestrians has varied in the last ten years – more time needed to establish trend. |
(c) Increase cycling safety - Reported cyclist collisions (number) | Poor Recent annual increases in collisions involving cyclists are of concern and place TMP target at risk of not being achieved. |
9. Enable efficient goods movement | |
(a) Minimize delay for trucks - Off peak road congestion (volume/cap ratio) | Good Despite continuing increases in annual heavy truck traffic, considerable off peak capacity still exists. |
10. Meet mobility needs of persons with Disabilities | |
(a) Increase accessibility of conventional transit service - Bus accessibility (% of low-floor buses) | Good The number and proportion of low floor buses have increased substantially in recent years, reaching 454 buses and 51% in 2004, respectively. Bus replacement program results have been effective in increasing accessibility of regular transit services. |
(b) Maintain adequate specialized transit Service - Usage (eligible passenger trips per capita) | Fair While total annual ridership has not varied significantly over the past ten years, the number of rides per capita has fallen slightly, from a high of 1.2 rides per capita in 1995 to 1.0 rides in 2004. The increased levels of accessibility that has occurred across regular transit services could be a contributing factor. |
(c) Increase accessibility of public rights-of- Way - Pedestrian crossing accessibility - Traffic signal accessibility | ? Current inventories of traffic signals with fully depressed curbs have been established. Ongoing reporting will establish performance. ? Current inventories of audio traffic signals have been established. Ongoing reporting will establish performance. |
| |
The following sections present some of the main highlights of the report addressing a number of indicators as they relate to automobile, transit, cycling and walking modes of travel.
1. Motor Vehicle Growth
The TMP objective is to ensure that automobile traffic growth is not increasing at a rate larger than the growth in population. This can be represented by the ratio of automobile traffic growth to population growth (with a target value of less than one).
Exhibits 1 through 4 show the relative growth in traffic in the following major growth areas:
§ East (Orleans) including Cumberland and the surrounding rural area;
§ Southeast (Gloucester) including Riverside South, Leitrim, Osgoode & the rural area;
§ Southwest (Nepean) including Barrhaven, Richmond and the surrounding rural area;
§ West (Kanata) including Stittsville, Carp and the surrounding rural area.
A review of each of four charts for each of the geographic areas, Exhibits 1 through 4, suggests that the trend over the past ten-year period is heading in the right direction with the traffic to population growth ratio falling for all regions with the exception of the Southeast (Gloucester).
Two factors may explain the findings. Firstly, the level of self-containment (i.e., large employment and population base) for each of these communities affects the observed annual traffic growth rates. Secondly, strong transit ridership into and out of the city centre would result in a dampening effect on the percentage growth of annual automobile traffic growth occurring in these areas. It is expected that the trend in Southeast (Gloucester) will reverse with the introduction of the North-South LRT service.
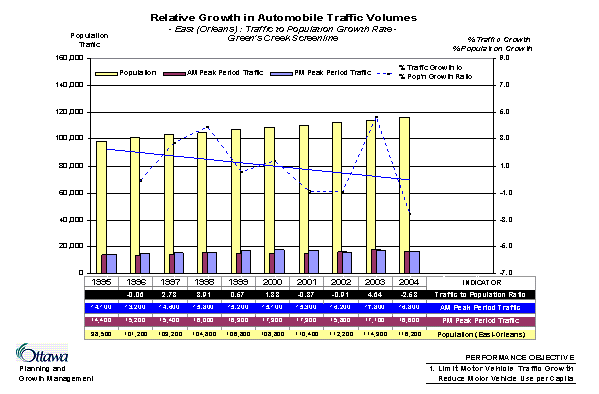
EXHIBIT 1: Relative Growth in Automobile Traffic Volumes- East (Orleans)
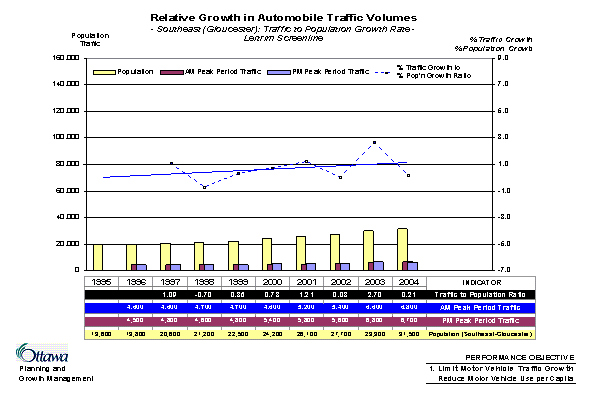
EXHIBIT 2: Relative Growth in Automobile Traffic Volumes- Southeast (Gloucester)
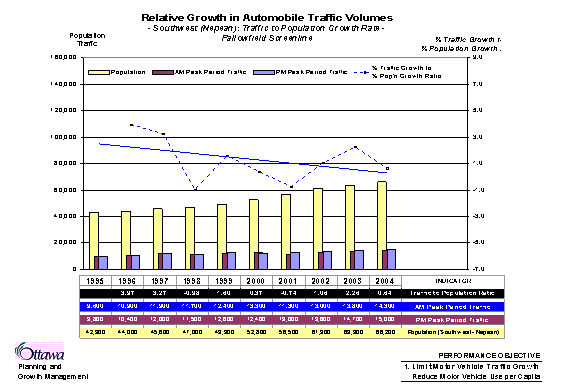
EXHIBIT 3: Relative Growth in Automobile Traffic Volumes- Southwest (Nepean)
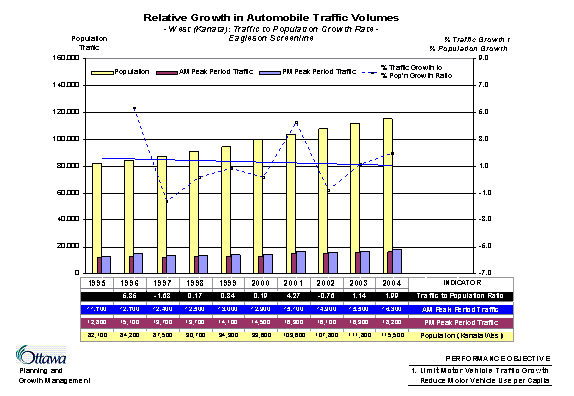
EXHIBIT 4: Relative Growth in Automobile Traffic Volumes- West (Kanata)
2. Auto Occupancy
Auto occupancy is defined as the number of persons carried (passengers) within individual vehicles. Currently the average auto occupancy is around 1.2. The TMP target is to increase it to 1.3 persons per vehicle by 2021.
Exhibits 5 and 6 represent the auto occupancy rates across a number of travel corridors as a proxy for citywide trends for the morning and afternoon commuter peak periods. The trend observed over the past ten years confirm a downward trend in the numbers of occupants per vehicle. The morning peak period, which is more heavily influenced by work trips, is significantly lower than the afternoon.
High auto ownership, car availability and transit service level clearly play a role in persons choosing to drive to work as either drivers or passengers in automobile. The development and implementation of HOV lanes within specific corridors as well as supporting measures (e.g. ridesharing programmes, preferential parking for carpools, etc.) are required to encourage commuters to ridesharing.
It should be noted that the average auto occupancy observed in Ottawa, while declining, is similar to that of many of major Canadian cities observed at approximately 1.2 persons per vehicle.
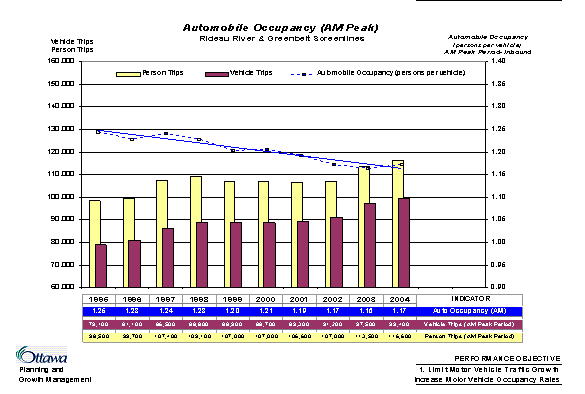
EXHIBIT 5: Auto Occupancy – AM Peak Period Inbound
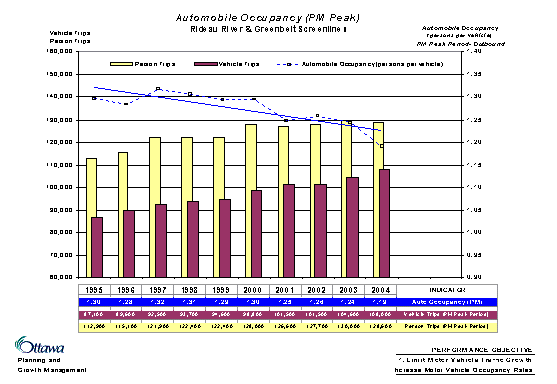
EXHIBIT 6: Auto Occupancy -- PM Peak Period Outbound
3. Transit Ridership
Annual transit ridership provides a measure of whether transit growth is keeping pace with population growth. As shown in Exhibit 7, annual transit ridership has been increasing in recent years. It has reached approximately 89 million in 2004 recovering from a low of 65 million riders in 1996. Per capita transit ridership during the same period has also increased steadily and has stabilized somewhat at approximately 120 rides per capita. The TMP target is to increase it to 200 rides per capita by 2021.
Overall transit ridership levels achieved can often be attributed to increases in the attractiveness and convenience of transit service, the extent of service coverage and frequency of service. In addition, increase in transit use can also be driven by increases in the cost of operating an automobile (e.g. parking costs and fuel costs) and increase in congestion level on road network.
Compared to other cities in North America with service area populations below 1 million, Ottawa has the highest transit rides per capita. This figure for Calgary is 69; for Edmonton is 67; for Winnipeg is 62; and for Portland, Oregon is 71.
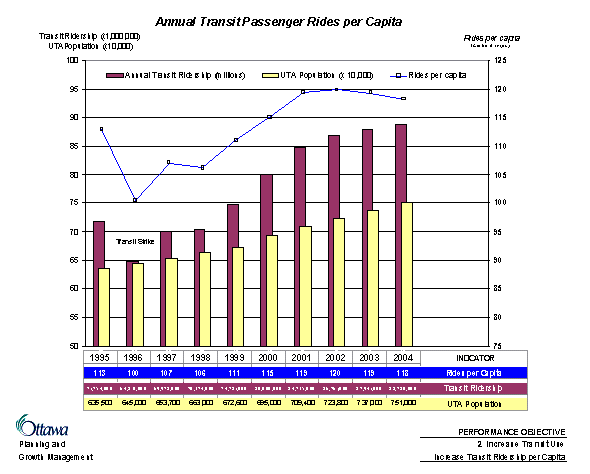
EXHIBIT 7: Transit Ridership per Capita
4. Transit Modal Split
The transit mode split is defined as the ratio transit trips to all motorized trips (i.e., transit plus automobile). The City’s objective of increasing transit modal split during pm peak hour to 30% by 2021, would translate into different target rates across different screenlines within the City. Exhibits 9 through 12 present transit split trends across a sample of four screenlines, which represent commute patterns to/from the City’s east, southeast, southwest, and west, respectively. Exhibit 8 shows the location of these screenlines.
East - Exhibit 9 shows the transit modal split trend across the Green’s Creek Screenline. Strong transit ridership to and from Orleans and Blackburn Hamlet communities over the past ten years has resulted in the attainment of relatively high modal split for transit, reaching about 36 % of all motorized person trips in 2004. The TMP target is 41% by 2021. Continued growth in transit ridership in this corridor will ensure the achievement of the TMP target.
Southeast - Exhibit 10 shows the transit modal split trend across the Leitrim Screenline. Current levels of transit ridership are low—around 1%, as public transit services are currently being introduced into these new urban growth centres. The commencement of the North-South LRT in 2009 as well as increased transit service frequency to the growing Riverside South are expected to increase significantly the transit mode split on this corridor. The TMP target is 32% by 2021.
Southwest - Exhibit 11 shows the transit modal split trend across the Fallowfield Screenline. The observed levels of transit use have varied between 8 and 11 percent. However, the Fallowfield Park and Ride lot located just north of this screenline may contribute to a possible understatement of observed transit mode split as many transit riders drive to this lot in order to access the rapid transit service. The TMP target for this screenline is 31% by 2021. Substantial increases in transit mode splits are required in concert with the planned urban growth to ensure the transit mode split will be sufficient to reach the TMP target. The extension of the Southwest Transitway to Barrhaven in conjunction with the introduction of Strandherd Park and Ride lot will ensure growth in the transit modal split in this area to achieve the TMP target.
West - Exhibit 12 shows the transit modal split trend across the Eagleson Screenline. The transit modal splits observed across this screenline have varied from one year to the next. The current levels of transit ridership represent a transit modal split of 18 %. The TMP target is 38% by 2021. While the ten year trend results is positive, continued growth in the transit mode split level above the current observed rate of growth will be required to reach the TMP target established for this travel corridor. Implementation of planned rapid transit infrastructure (East-West LRT, West Transitway) will ensure growth in the transit modal split in this area.
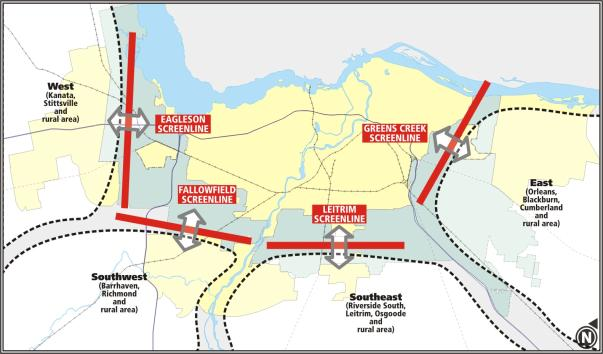
EXHIBIT 8: Screenline Map – Strategic Travel Corridors
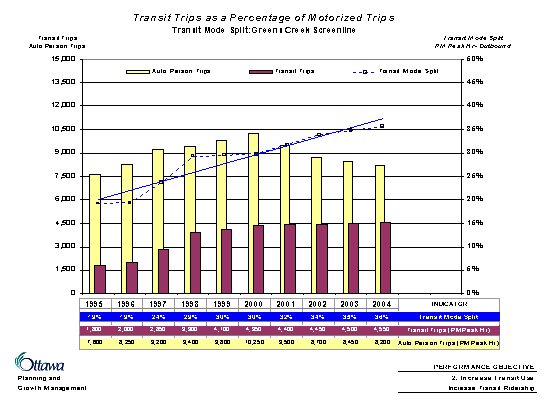
EXHIBIT 9: Transit Mode Split -- Greens Creek Screenline
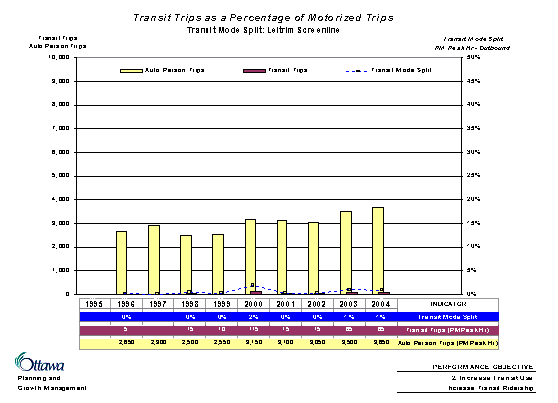
EXHIBIT 10: Transit Mode Split – Leitrim Screenline
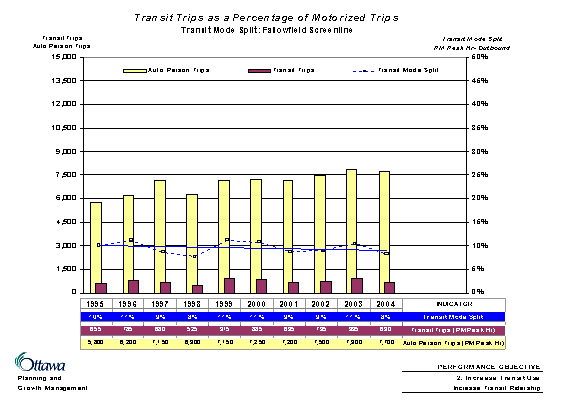
EXHIBIT 11: Transit Mode Split -- Fallowfield Screenline
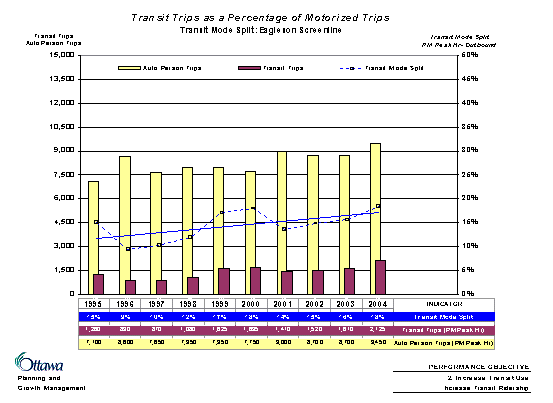
EXHIBIT 12: Transit Mode Split -- Eagleson Screenline
5. Cycling Modal Share
A region-wide Origin-Destination survey, which is currently undertaken every ten years, is the best way to monitor citywide cycling use. An O-D survey was recently completed in the fall of 2005 and results of this data collection will be finalized by midyear 2006. In the meantime, there are other indicators that can be used to monitor cycling use trends over time:
§ Cycling modal share at the Inner Area Cordon; and
§ Cycling Activity Index
The chart of observed cycling mode share as depicted in Exhibit 13 reflects a drop in the modal share from a high of almost 2.5% of all trips to an approximate current level of 1.9%. The data collected represent spring conditions. The level of cycling can be heavily influenced by time of year and weather conditions.
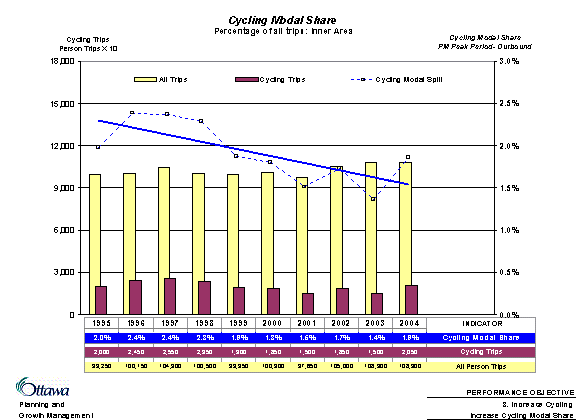
EXHIBIT 13: Cycling Mode Share -- Inner Area Cordon
The cycling index is another means to monitor relative changes in cycling activity over time. The index is designed to report on cycling activity as a function of overall road traffic volume and is also normalized to account for weather conditions. The data show that cycling index has fallen steadily over time from a high of 200 cyclists per every 10,000 vehicles in 1996 to about 135 cyclists observed at intersections across the city in 2004.
However, despite the downward trend, according to the 2001 Statistics Canada report, Ottawa still enjoys the second highest cycling modal share after Victoria (at 5.0%). This figure for other major Canadian cities with population of more than 250,000 varies between 0.5% and 1.5%.
6. Walking Modal Share
As with cycling trips, a region-wide Origin-Destination survey is the best way to monitor citywide walking share. In the meantime, it is possible to use the counts of walking trips at the Central Business District (CBD) Cordon to monitor walking modal share over time.
The walking mode share as depicted in Exhibit14 shows a level of variation over time, however the trend line over the past ten years is positive and suggests current walk shares in the CBD are approximately 12% of total trips for the afternoon peak period.
As with cycling, Ottawa enjoys one of the highest walking modal share among all major Canadian cities, third after Victoria and Halifax. According to the 2001 Statistics Canada report, the citywide walking modal share for Victoria, Halifax, and Ottawa are 10.4%, 10.3%, and 7.6%, respectively. This figure for other major Canadian cities with population of more than 250,000 varies between 3.6% and 6.9%.
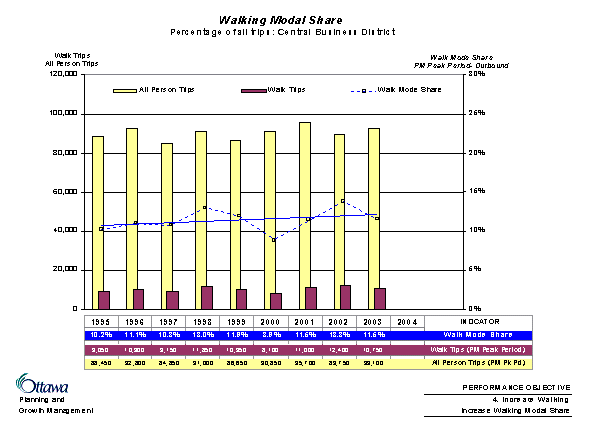
EXHIBIT 14: Walking Mode Share -- Central Business District Cordon
7. Mobility Needs of People with Disability
The City would like to ensure that the transportation service provided to its residents is delivered in a manner that respects the needs of all sectors of the community.
Provision of accessible transit buses (i.e., low-floor) is a means to ensure higher levels of transit use by members of the disabled community. As demonstrated in Exhibit 15, the number of low floor buses in OC Transpo’s bus fleet has increased substantially in recent years rising from 110 in 1999 to approximately 454 in 2004, representing 51% of the active bus fleet. The City’s objective is to have a fully accessible transit fleet by 2015.
Provision of specialized transit service (i.e., Para Transpo) is also important for a particular client group whose disabilities affect their use and access to regular public transit services. Exhibit 16 shows that while the total annual ridership of Para Transpo services has not varied significantly over the past ten years, the annual ridership per capita has fallen from a high of almost 1.2 annual rides per capita in 1995 to approximately 1.0 rides per capita recorded in 2004. One factor contributing to the decline of the usage for this specialized service is the introduction of low floor buses into the general fleet. A portion of the ridership who had previously accessed Para Transpo services may now have their mobility needs meet through the use of low floor buses in the fleet. In addition, since 2002 the City of Ottawa has made some changes in determining eligibility criteria in using Para Transpo services.
Despite the decrease in number of rides per capita, Ottawa is ranked third highest compared to all other Canadian municipalities with a population over 150,000. In 2004, the average number of specialized transit riders per capita was 0.57 for Ontario and 0.67 nationally.
8. Peak Spreading of Automobile Demand
Spreading the travel demand across a longer time frame is a means to reduce peak congestion levels and to maximize effective use of infrastructure. The ratio of both the morning and afternoon commuter peak periods to the observed twelve-hour traffic demands has been relatively constant over the past ten years (slightly more than 50% of daily trips occur within the two peak periods) suggesting that peaking characteristics have remained unchanged.
9. Peak Spreading of Transit Demand
Opportunities to reduce the transit peaks (and spread the travel demand across a wider time frame) would result in fewer transit vehicles to service similar levels of passenger demands during peak travel times, which in turn, would reduce operating costs.
The proportion of transit riders using the transit system during the peak commuter periods (6:30 to 9:30 am and 3:30 to 6:30 pm) has fallen slightly over the past ten years indicating that larger segments of the daily ridership growth have been attracted to the off-peak time periods. Current ridership profiles indicate that about 57% of the daily ridership occurs during the two peak periods compared to 59% in 1995.
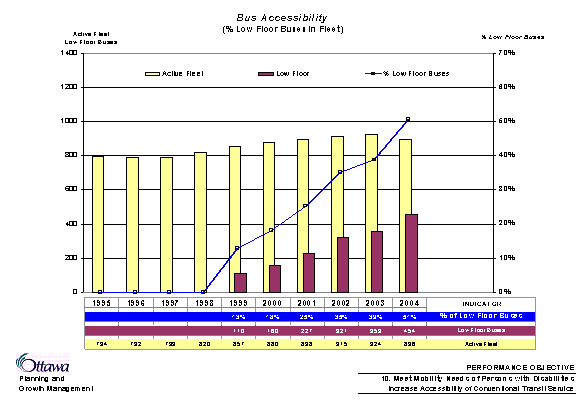
EXHIBIT 15: Bus Accessibility
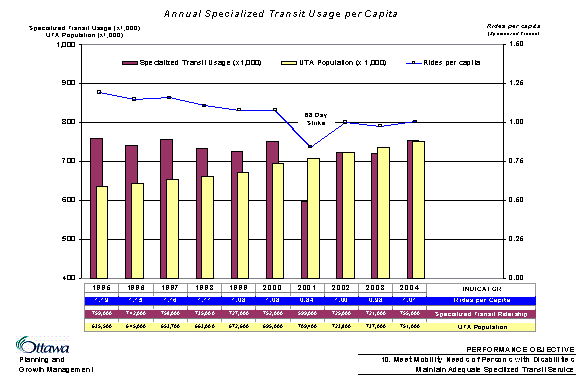
EXHIBIT 16: Para Transpo Ridership per Capita
CONSULTATION
No public consultation took place in the development of this report. The objectives and performance measurement indicators were defined as part of the development of the TMP, which entailed significant public consultation.
FINANCIAL IMPLICATIONS
There are no financial implications as a result of this report.
SUPPORTING DOCUMENTATION
Document 1 Transportation Monitoring Report – Phase I (on file with the City Clerk)
DISPOSITION
The Department of Planning and Growth Management will proceed with Phase II of the Transportation Monitoring effort on the status of the remaining transportation indicators in 2006.