
Transit Committee: 10 September 2026
On 10 September, Transit Committee made its final meeting before the October election to discuss the Customer First Action Plan, service reliability, and the bus fleet.
On 10 September, Transit Committee made its final meeting before the October election. Among the items discussed includes the Customer First Action Plan, service reliability, and the bus fleet. Stage 2, as always, has been quarantined into its own post - I am hoping to post that soon, but it may take a little longer.
The meeting video and agenda are posted on YouTube and the meetings and agendas portal.
Documents list:
- Response to inquiry (Lo): Impacts of service disruptions on equity-seeking groups
- Response to inquiry (Lo): Route level service reliability statistics - Winter 2026 (!)
- Response to inquiry (Plante): Complaint from customer waiting at bus stop
- Response to inquiry (Carr): Reports of broken fare machines
- Stage 2 Light Rail Transit Report
- Council motion (Brockington - referred to Transit Committee): Reinstating Saturday service on Route 92
Update
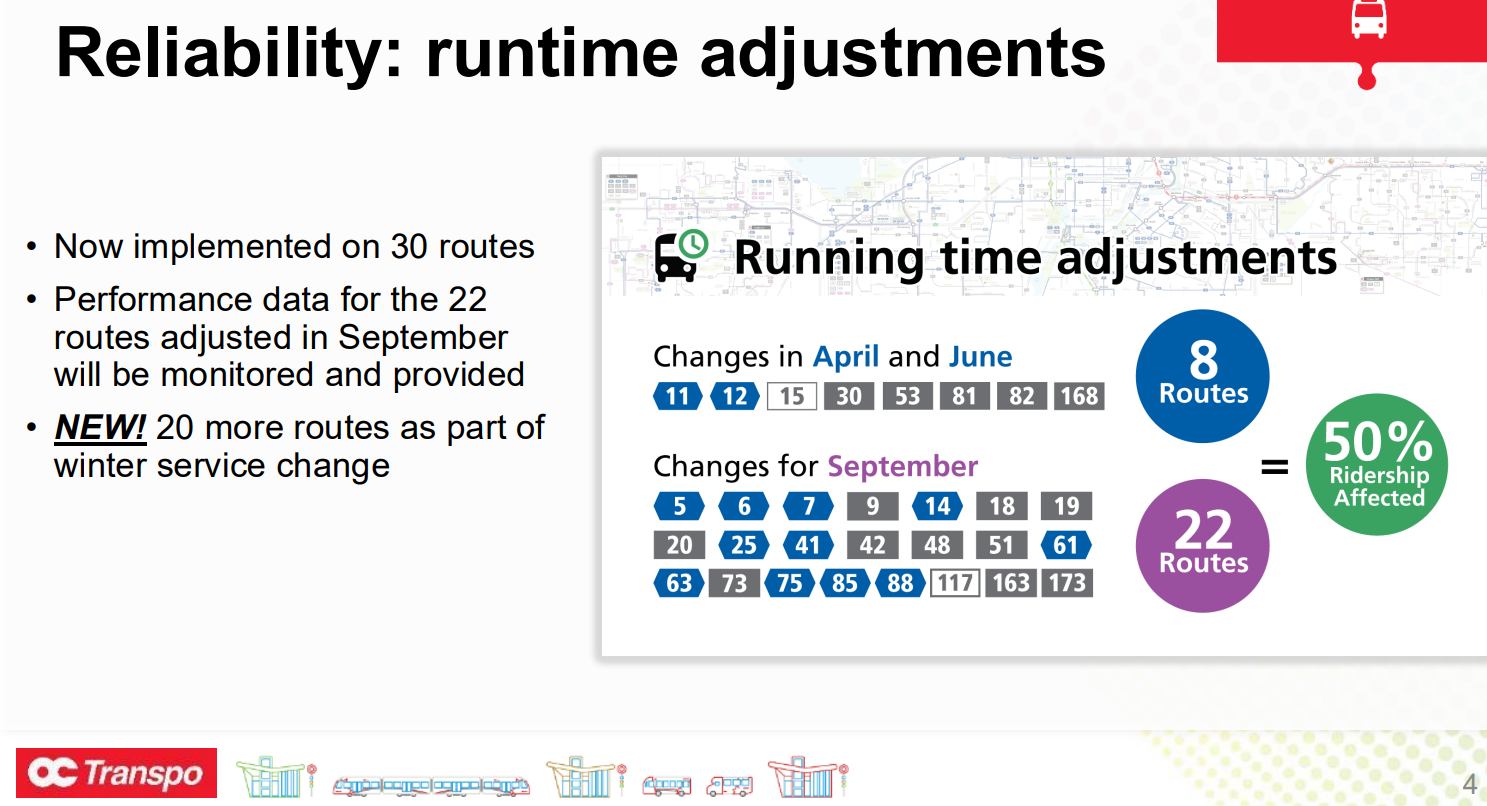
OC Transpo introduced service changes on 30 August. These include more express buses from Kanata and Orleans; new interlining providing through-service from Tunney's Pasture into Gatineau; more padding on 22 routes, adding to eight from the June service changes; new northbound trips in the morning on Line 2; and increased weekday frequency on Line 1 (but notably not weekends), increasing peak service to every four minutes, midday service to every six, and evening service to every 7.5.
General manager Rick Leary also announced runtime changes for 20 more routes in December, these (tentatively) being the 8, 10, 13, 40, 56, 57, 57, 60, 62, 74, 93, 94, 98, 99, 105, 110, 111, 161, 162, and 165.
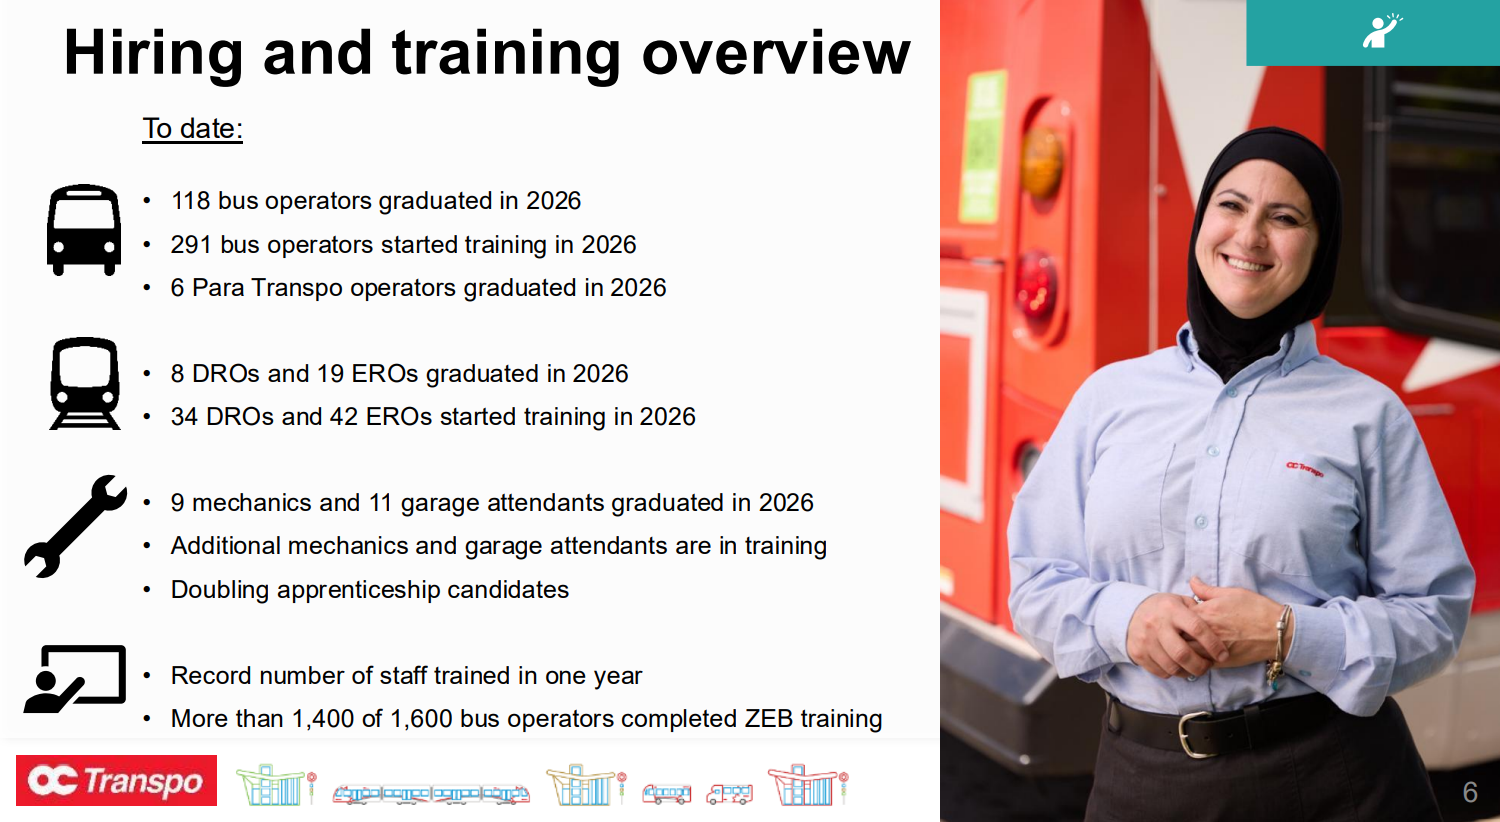
Leary announced progress on OC Transpo's hiring targets, calling it a record. So far this year, 291 bus operators have begun training; 118 have graduated; six Para Transpo operators have graduated; 8 diesel rail and 19 electric rail operators have graduated; and 34 and 42 have begun training, respectively. OC Transpo has also graduated nine mechanics and eleven garage attendents.
Over 1400/1600 of bus operators have completed electric bus training, 85% of all bus drivers.
Leary announced that going forwards, OC Transpo will target 105% of required staff, instead of the (implicitly) 100% targeted before.
Leary also introduced more "customer-focused KPIs" (which is a ridiculous turn of phrase). There are improved y-axes, finally! - and some metrics are better defined and more representative of the experience of the average rider on the street.
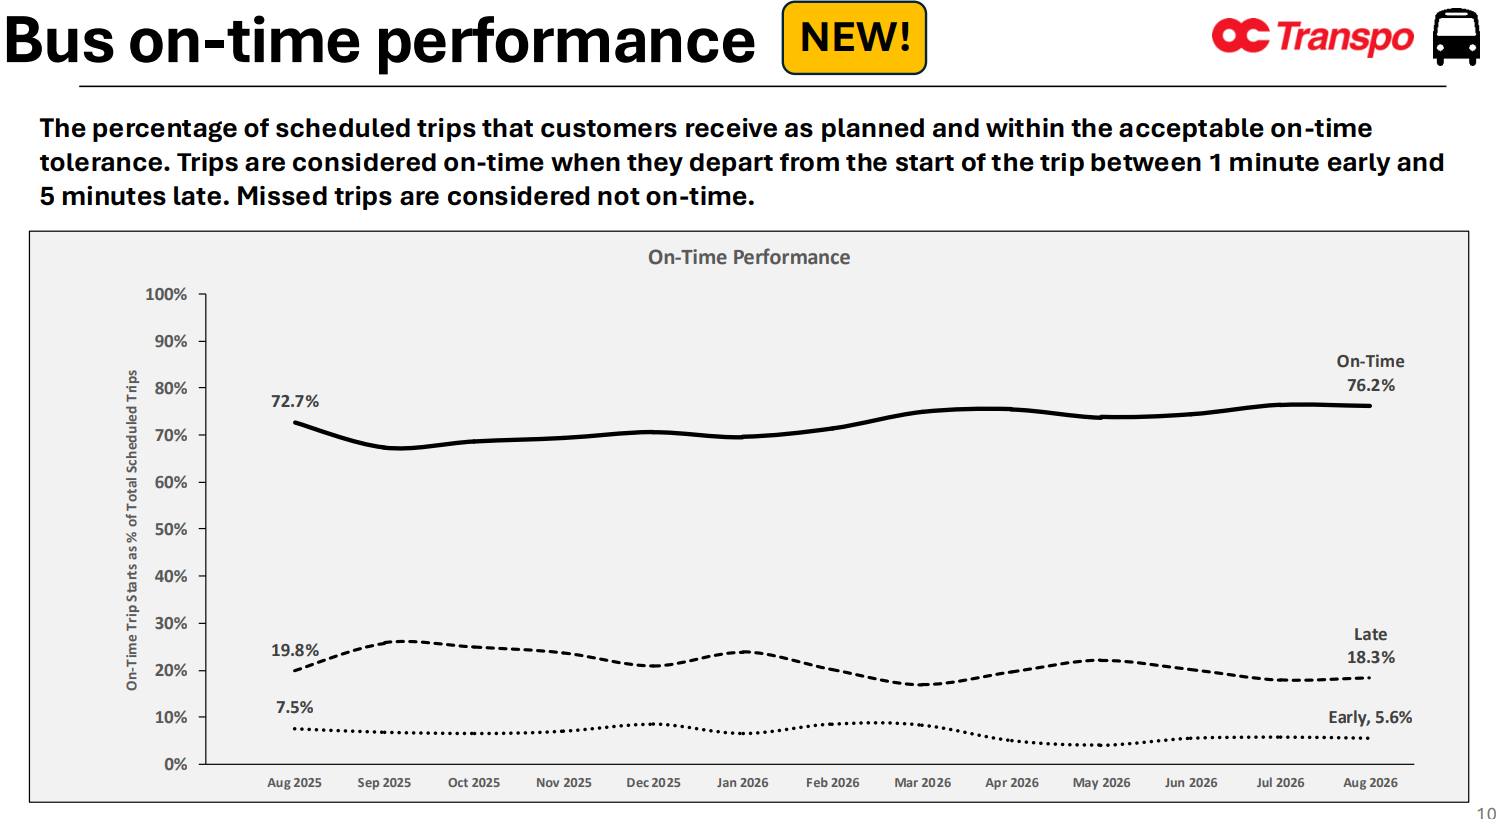
The on-time performance metric has been changed, yet again, to measure all bus routes, not only infrequent routes as it was under Amilcar. It has also been clarified to show that cancelled trips are not considered on-time. Under this standard, on-time performance was 72.7% in August 2025 (compared to the Amilcar figure of 71.2%) and 76.2% this August; of the 23.8% of trips that were not on-time, 5.6% were early and 18.3% were late. The definition of on-time remains the same, allowing buses to be up to one minute early or five minutes late.
However, this new metric only measures buses at the terminal and does not measure trips which fall behind enroute.
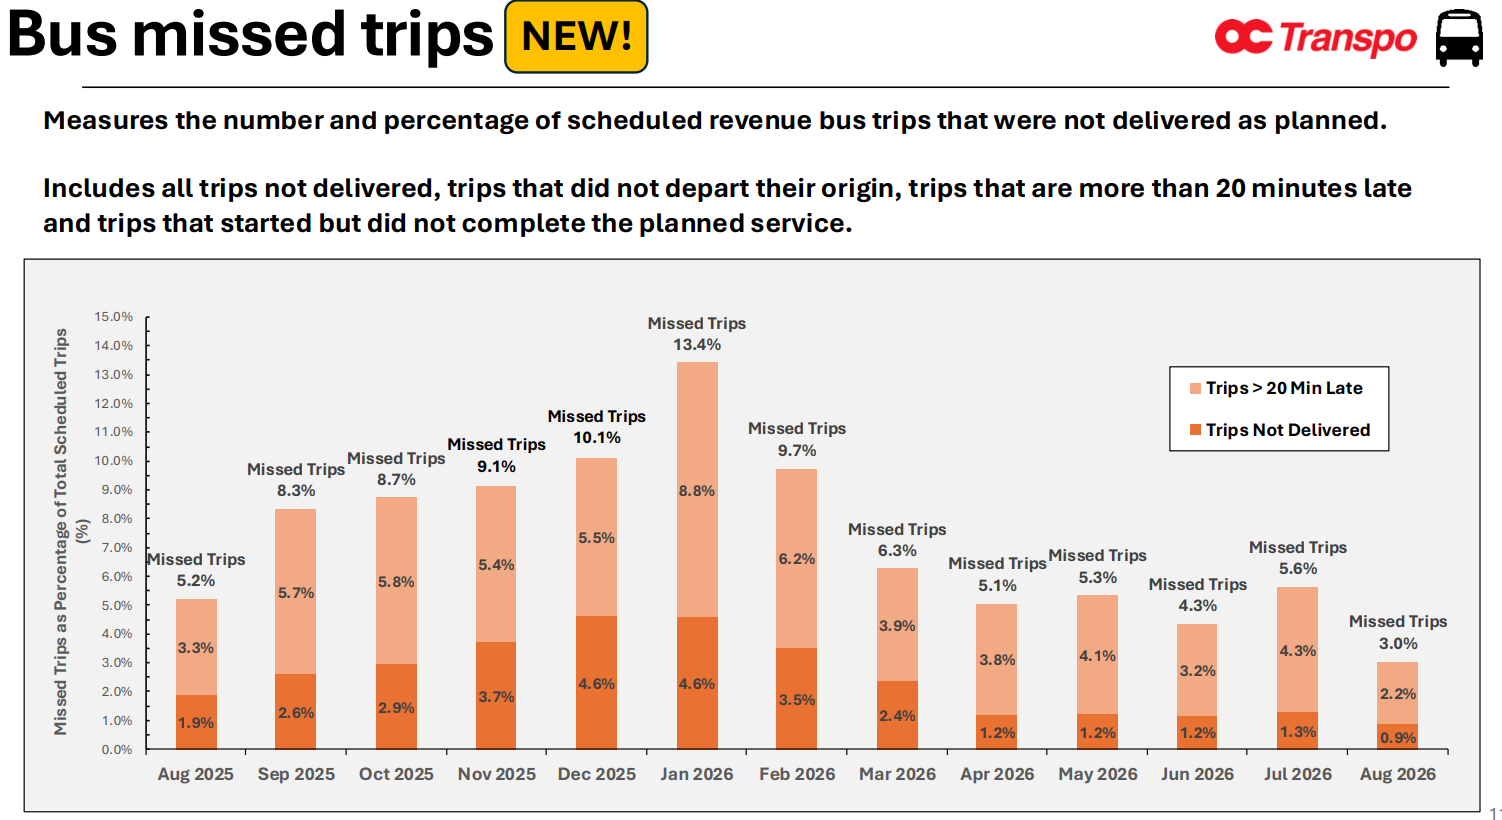
"Undelivered trips" has been replaced with another new KPI, missed trips. The graphs for this statistic are good, showing the amount of cancelled trips instead of uncancelled trips, and giving a more realistic view of operations. Missed trips have two components; the "trips not delivered," which conforms to the previous undelivered trips KPI and 0.9% in August; and trips over 20 minutes late, which are treated as a missed trip, 2.2% of August trips for a total of 3.0% trips missed in August 2026, the lowest level in the last twelve months.
These do not include temporarily cancelled weekend trips as part of the Customer First Action Plan, despite functioning as a missed trip to the rider on the street wondering where their bus is.
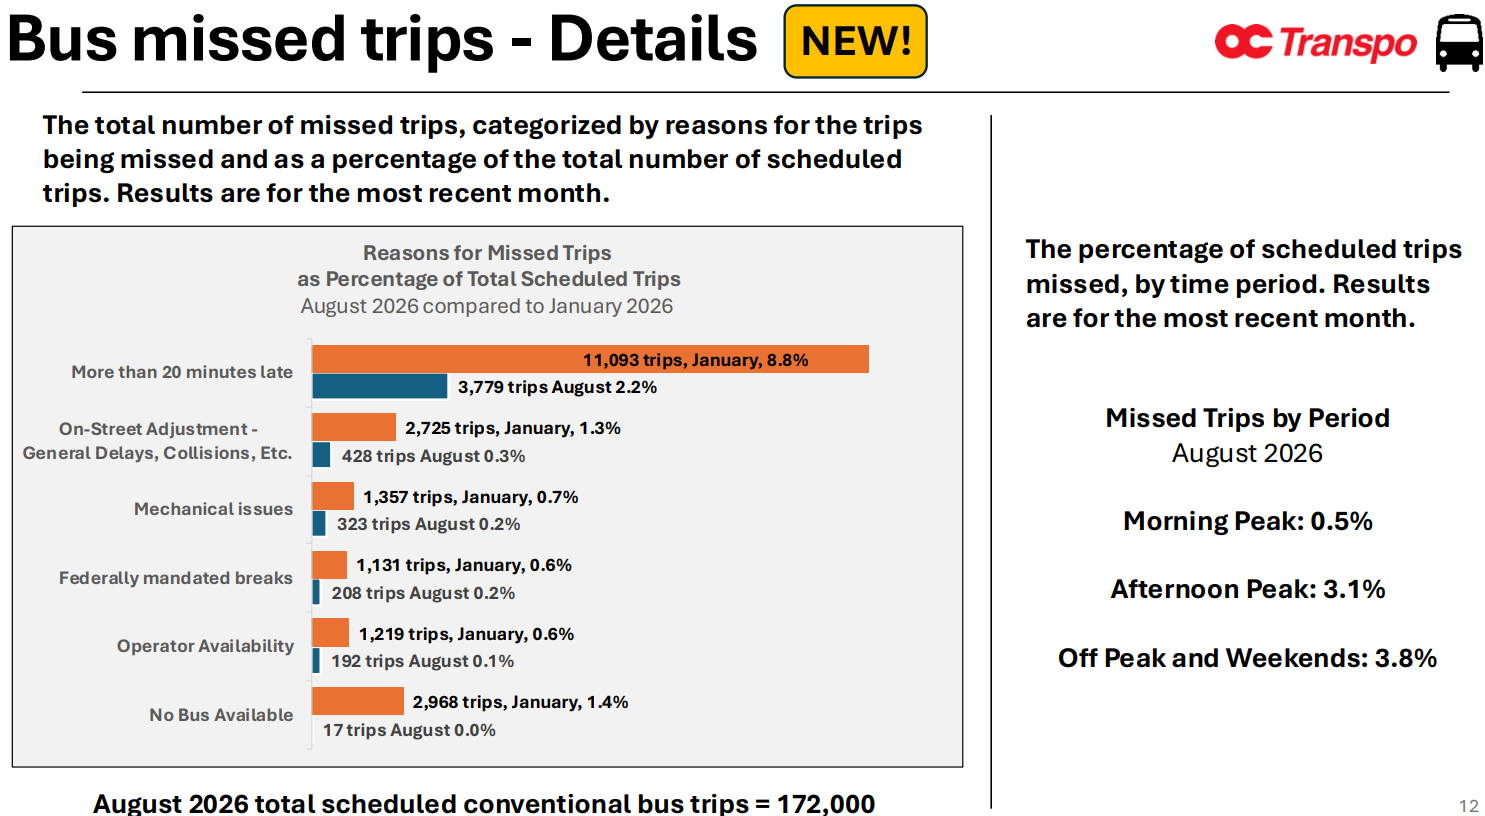
Of the missed trips, 2.2% were due to being over 20 minutes late; 0.3% due to the catch-all category "on street adjustments," which includes everything from active management to general delays; 0.2% due to mechanical issues; 0.2% due to the Canada Labour Code requirement for half hour lunch breaks; and 0.1% due to operator availability. The fleet crisis is essentially over with only 17 trips cancelled due to lack of buses in August.
As always, missed trips vary by time of day. The AM Peak has 0.5% missed trips, being at the start of the service day before delays can accumulate. The afternoon peak is at 3.1%, and off-peak service at 3.8%. This is despite the common narrative of congestion and lack of buses causing missed trips; one would expect peak periods to see the most congestion and the highest need for fleet availability, which does not seem to be the case here.
Staff promised similar KPIs for the O-Train, but the KPI is not yet ready for publication.
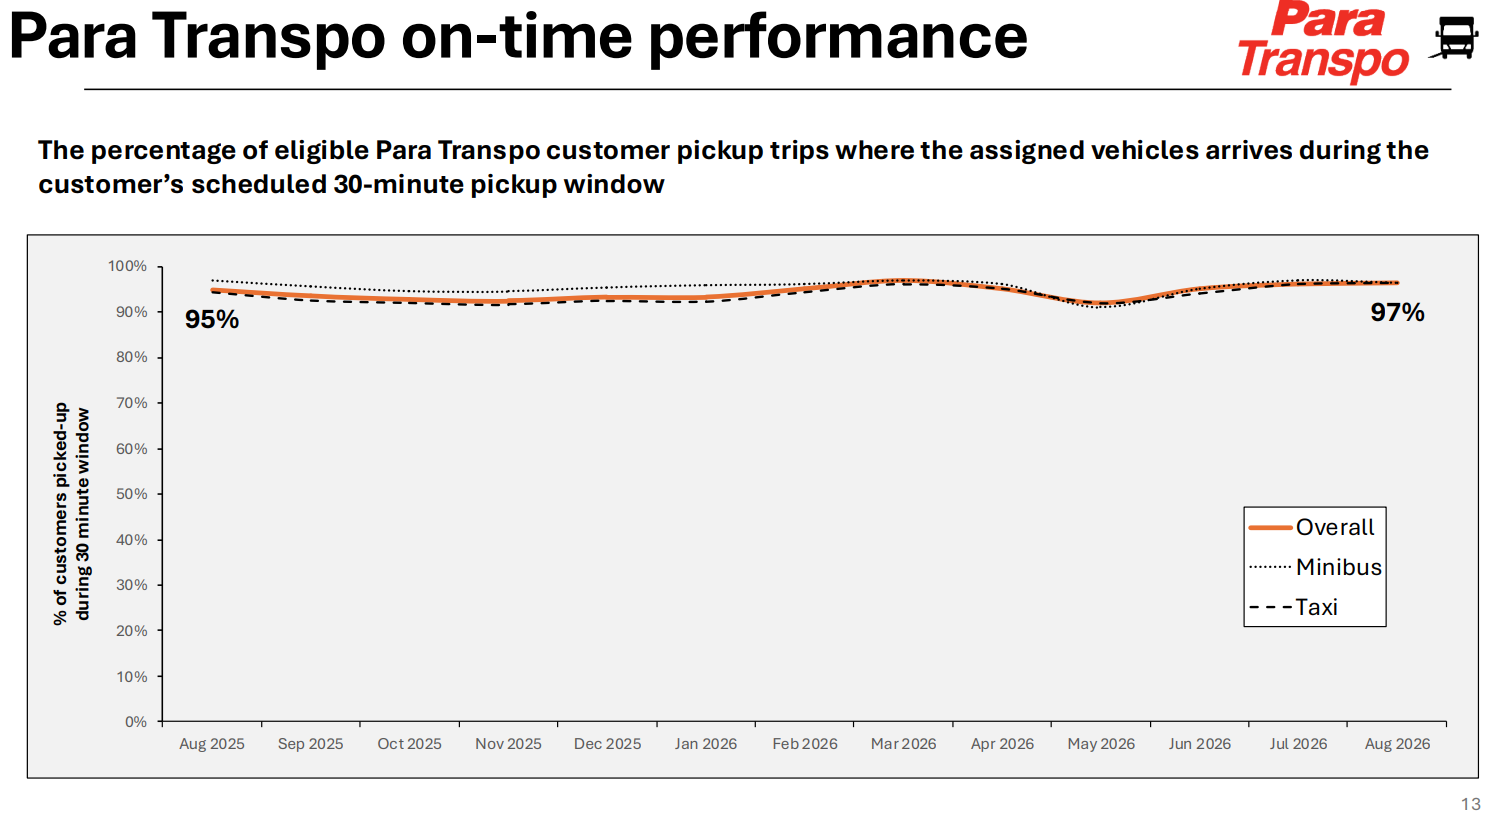
Para Transpo had an on-time performance of 97%, with apparently similar performance for the minibuses and taxis. This is measured within a 30 minute pickup window, which Para Transpo uses to schedule customers.
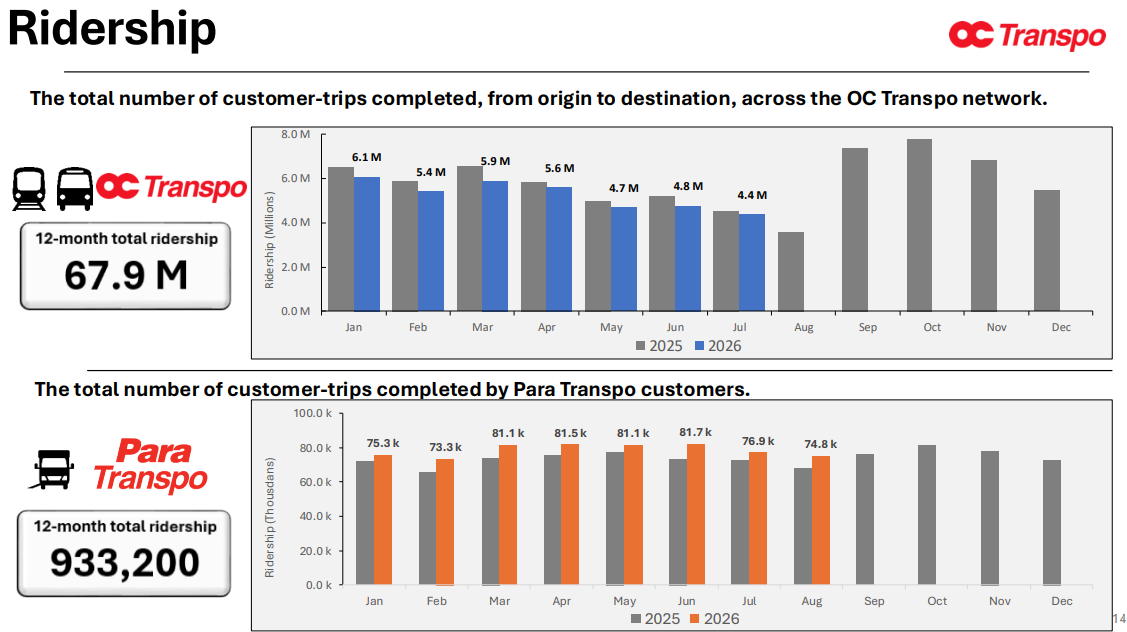
Monthly ridership, compared to the same time in 2025, has fallen since the beginning of the year. Ridership in July was 4.4 million, compared to 4.5 million last year; the same is true of June (4.8 million versus 5.2 million) and May (4.7 million/5.0 million). Considering that OC Transpo is relying on a $23 million fare revenue increase, and that ridership is far below pre-pandemic levels, this is a bad trend.
Para Transpo ridership is increasing, which has been a trend since I began writing these updates.
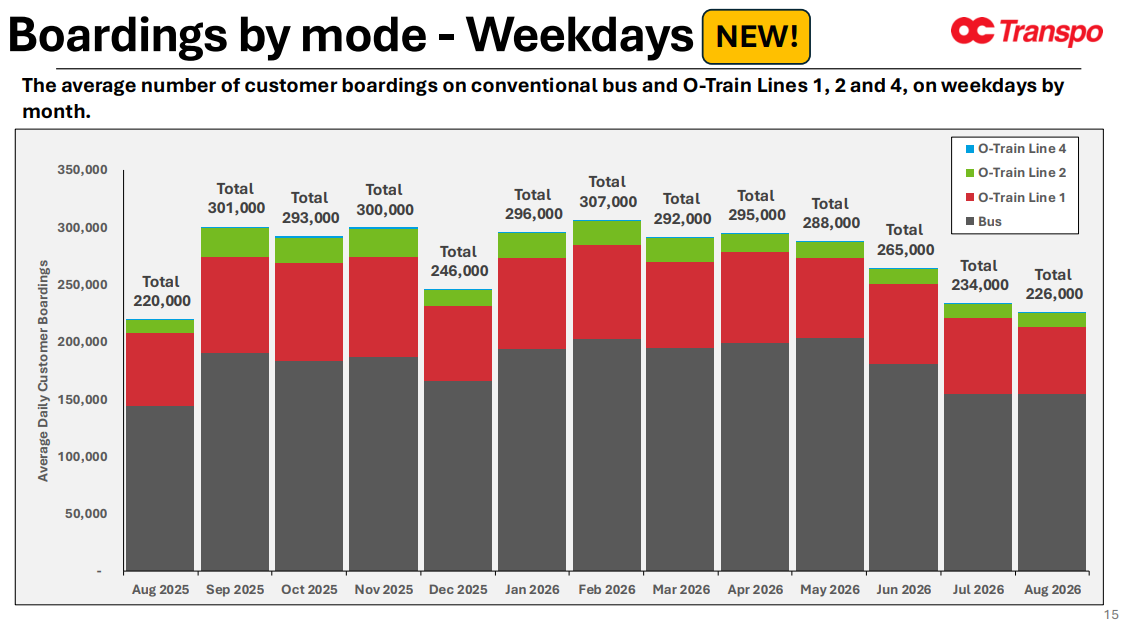
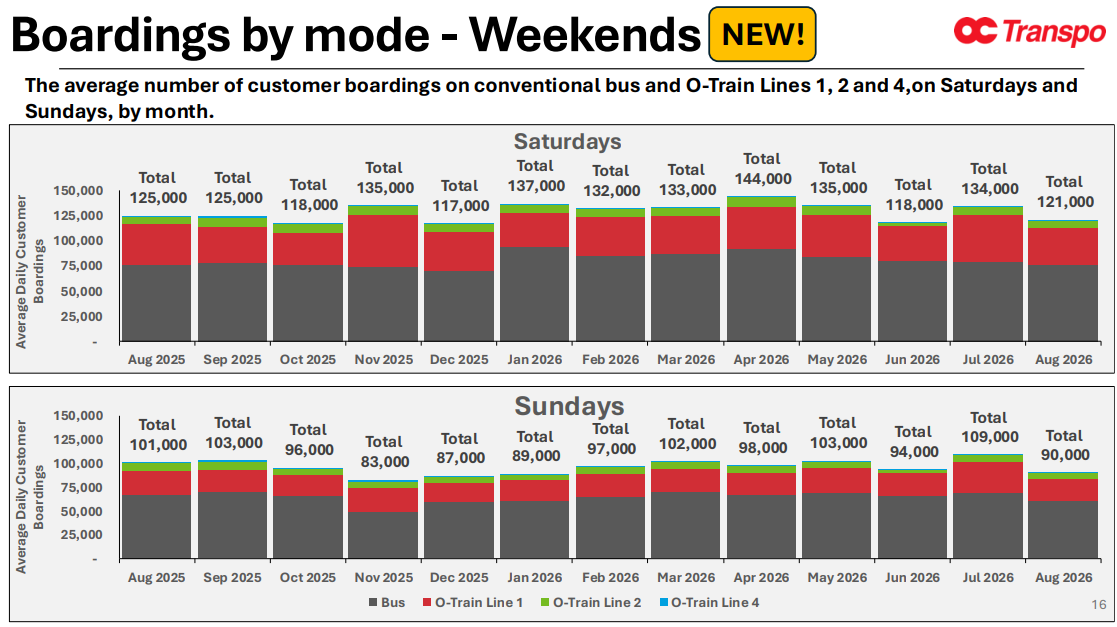
Boardings were also split by mode and by day of the week, with no labels (because this is OC Transpo). Weekday boardings sat at 226,000 in August, up from 220,000 in August 2025; however, Saturday ridership dropped from 125,000 to 121,000, and Sunday ridership from 101,000 to 90,000. Despite (or perhaps, because of) the focus on weekday improvements, weekend ridership has been left to rot, dragging overall ridership down with it.
About 2/3 of all boardings are made on the bus network, and 1/3 on Lines 1/2. If you squint, you can also see Line 4.
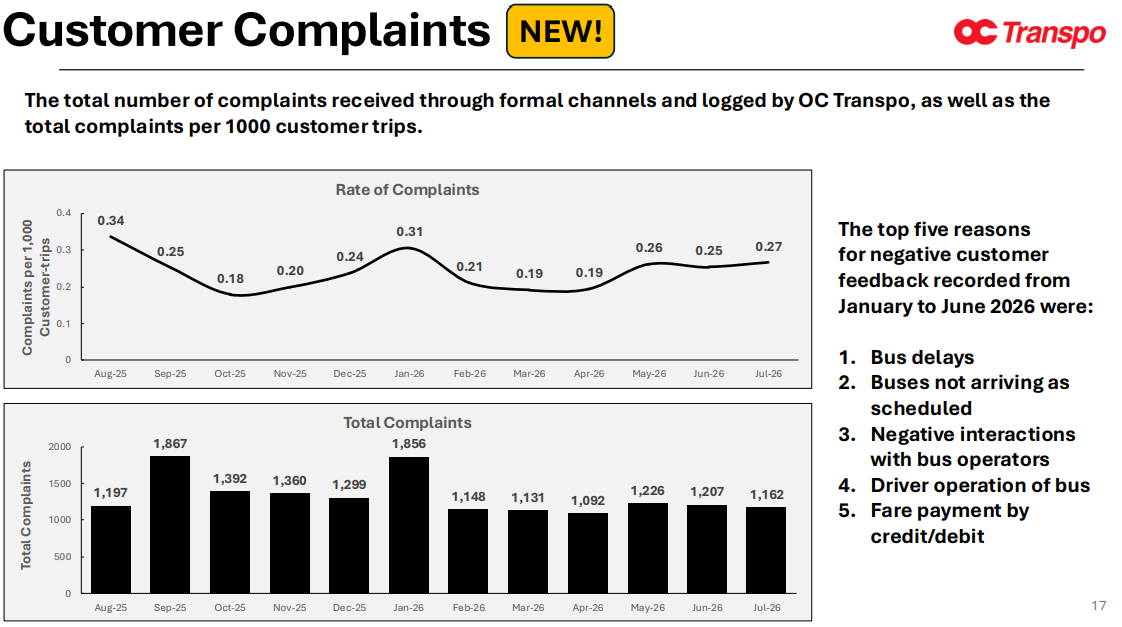
In July, customer complaints per thousand reached 0.27, higher than the winter but less than the peaks in summer 2025 and at the height of the fleet crisis in January 2026.
The maintenance backlog has shrunk from 15,000 hours last fall and 18,000 hours in January to less than 4,000 hours ("3/4 from last year ..."), increasing the amount of resources available to conduct preventative maintenance.
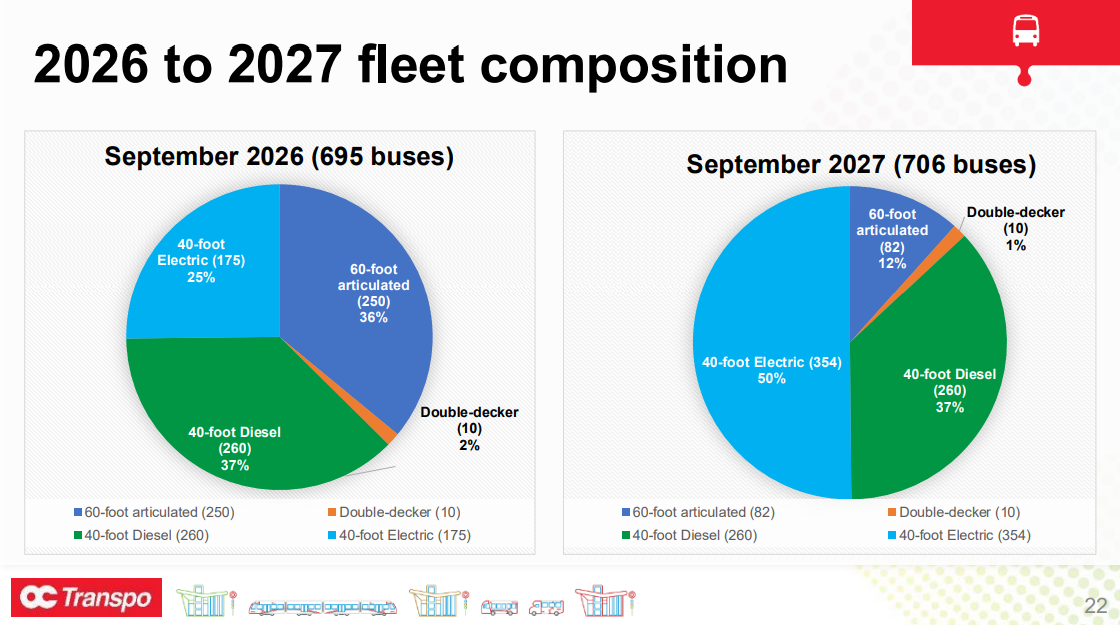
The fleet composition is rapidly changing 53 articulated buses retired and 44 more electric buses since June, for a total of 175 e-buses.
. By this time next year, the fleet will grow from 695 to 706 buses, while the high capacity fleet (that is, the double decker and articulated buses) will shrink from 260 to 92 buses. It is unclear whether such a small fleet can meet capacity needs, especially given the sorry state of reliability on the frequent network. We may be in for many more pass ups and crowded buses in the years to come.
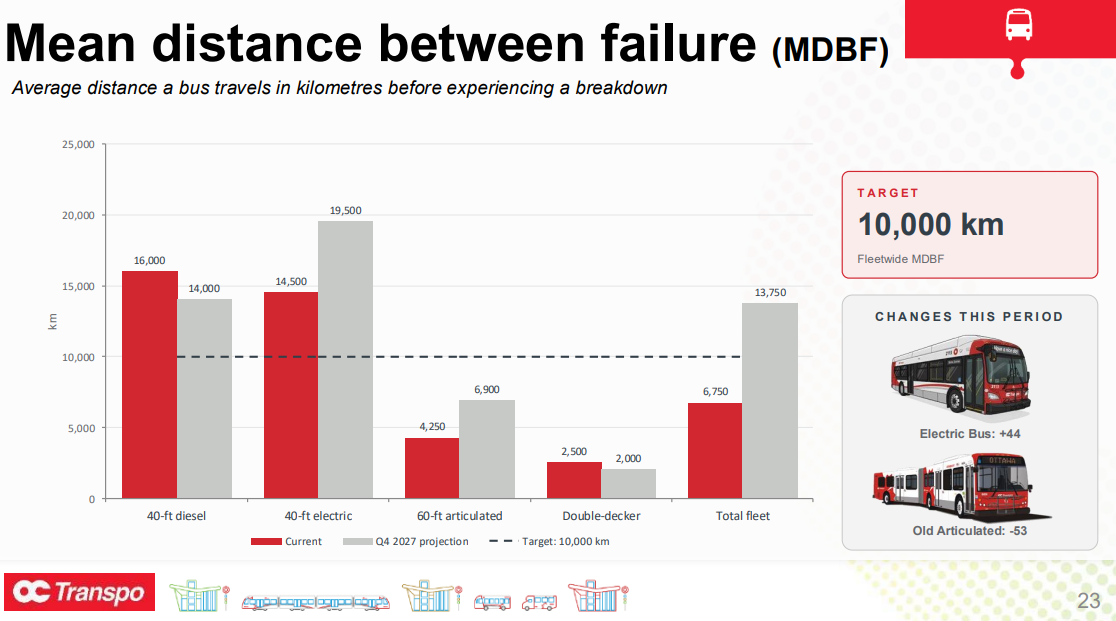
The MDBF (mean distance between failure) is at 6,750 km, compared to a target of 10,000 km, which is anticipated to rise to 13,750 km by September 2027.
The 40-ft Nova buses, delivered in the late 2010s and early 2020s, are reaching the middle of their service life, "helped" by very intensive use during the fleet crisis. Their refurbishment, funded partly with money intended for the now-retired articulated buses, is beginning, but we will only see what OC Transpo plans for their long-term when the promised fleet and capital plans are released.
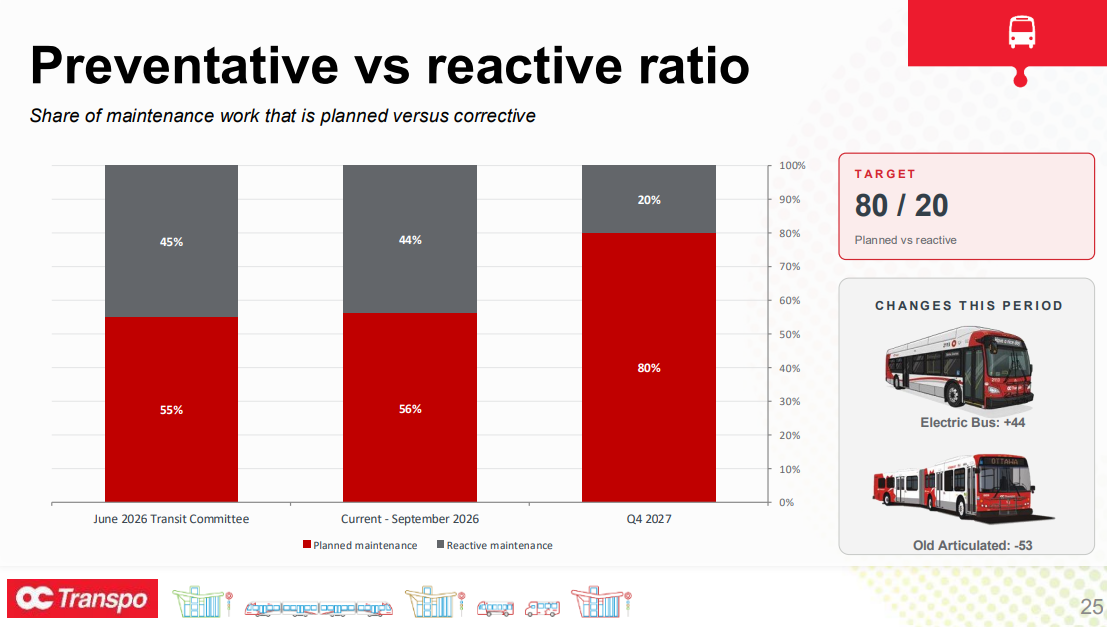
The proportion of maintenance hours dedicated to preventative work is at 56%, up from 30% in the past year, 51% in May, and 55% in June. OC Transpo's target is to have 80% of maintenance hours used on preventative maintenance by the end of next year, an ambitious target helped by large-scale fleet retirement and replacement.
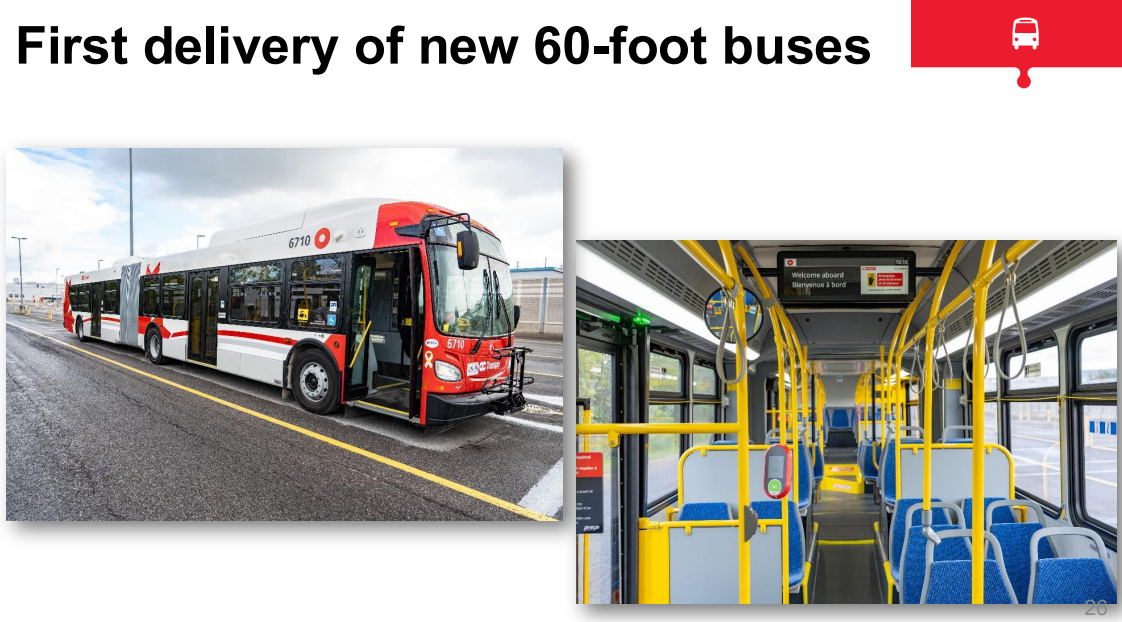
OC Transpo has begun receiving their order of 52 diesel articulated buses, which will make up most of the high-capacity fleet by next year. Staff are conducting training and testing on it.
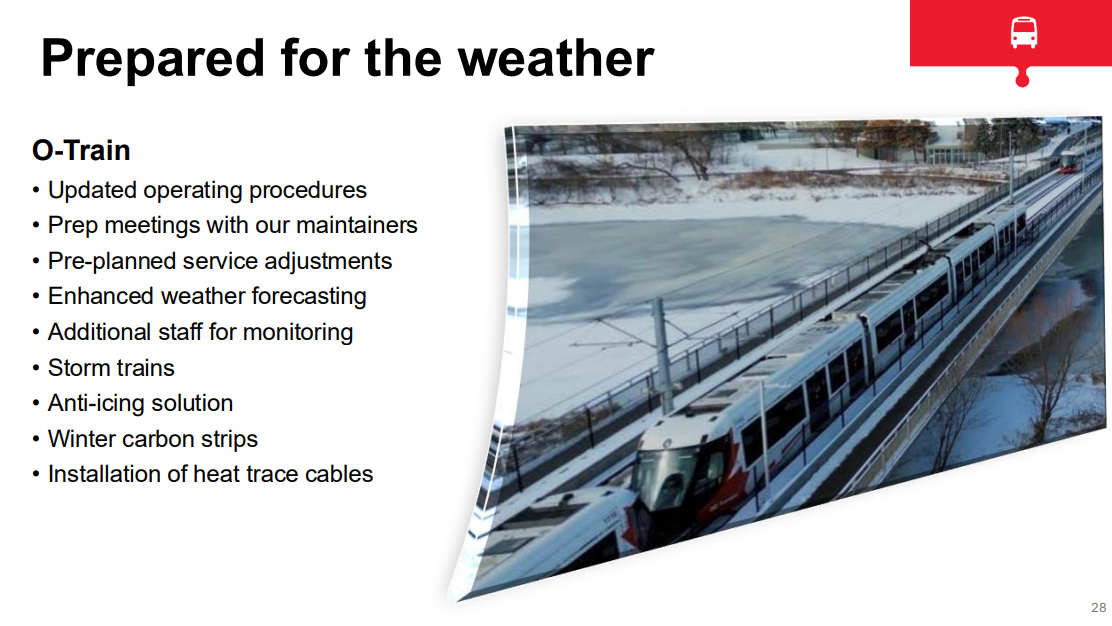
As part of preparations for the coming winter, OC Transpo is piloting new tire treads to improve grip and preparing for the installation of heat trace cables on Line 1 between Lees and Tremblay, where service has been cut in previous winter seasons.
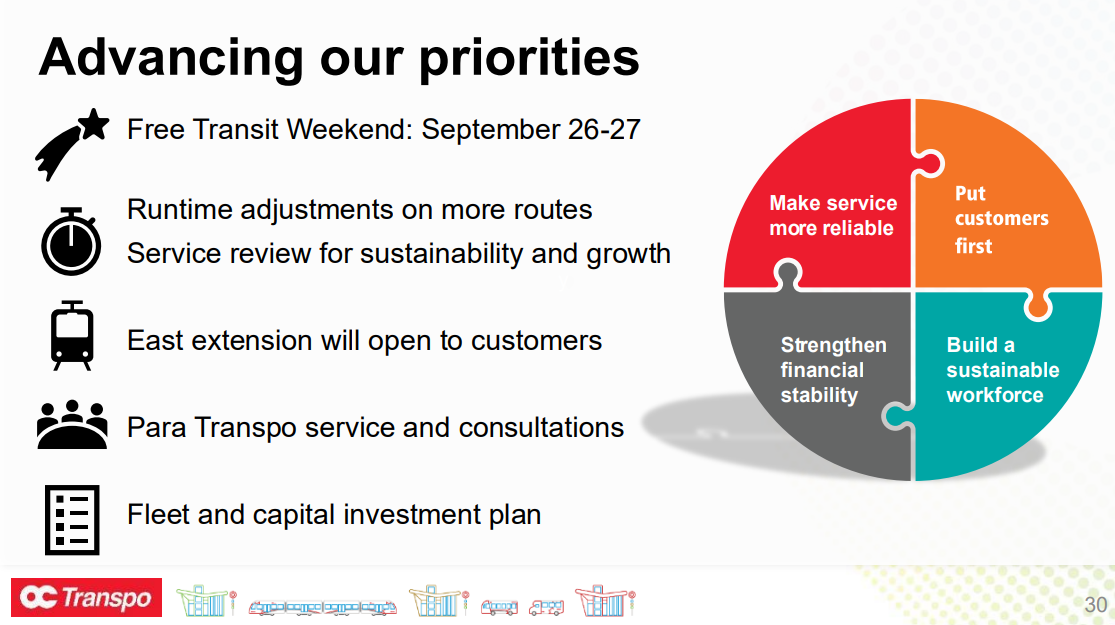
As part of the "Customer First Action Plan," staff announced one of two fare-free weekends, scheduled for 26/27 September. The second will be held when Stage 2 East opens, which the plan says should occur - but how a "customer-first action plan" changes a transit line's opening date is unclear.
Leary confirmed work continues on a fleet and capital investment plan; there is minor progress on Para Transpo, with expanded Friday and Saturday hours; and runtime reviews for a large portion of the bus network - despite a recent comprehensive service change in the form of New Ways to Bus which should have produced these natively (although that is not Leary's fault).
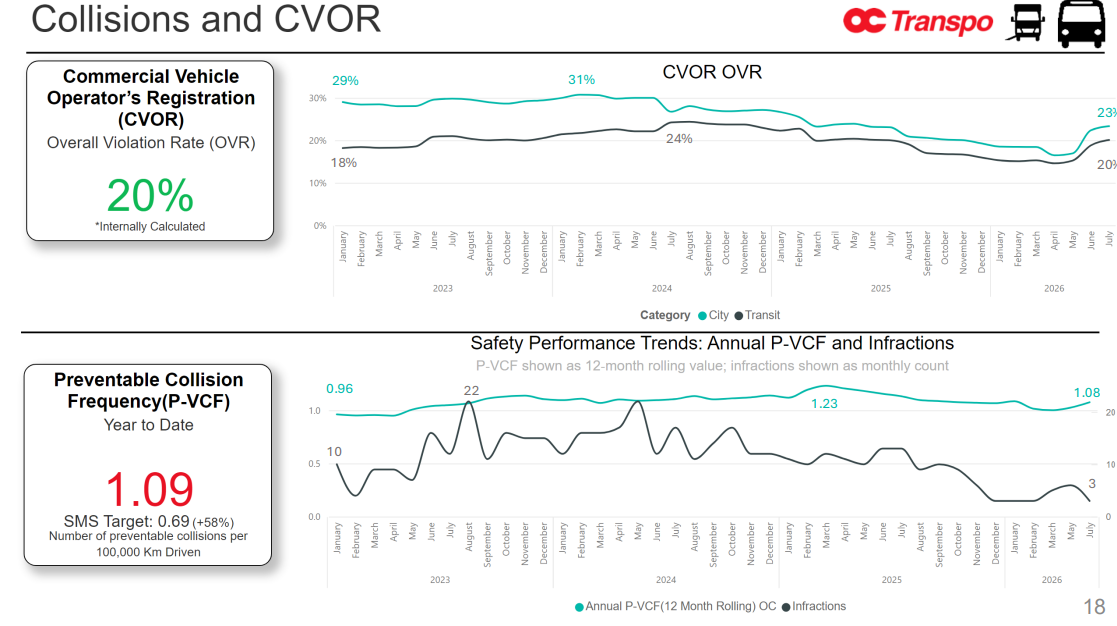
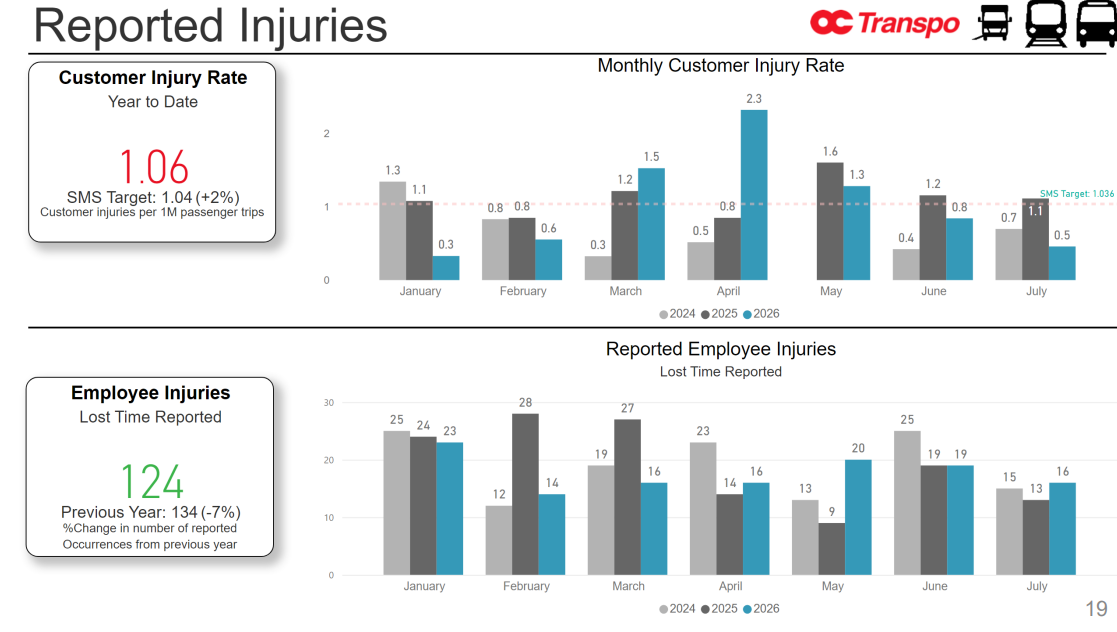
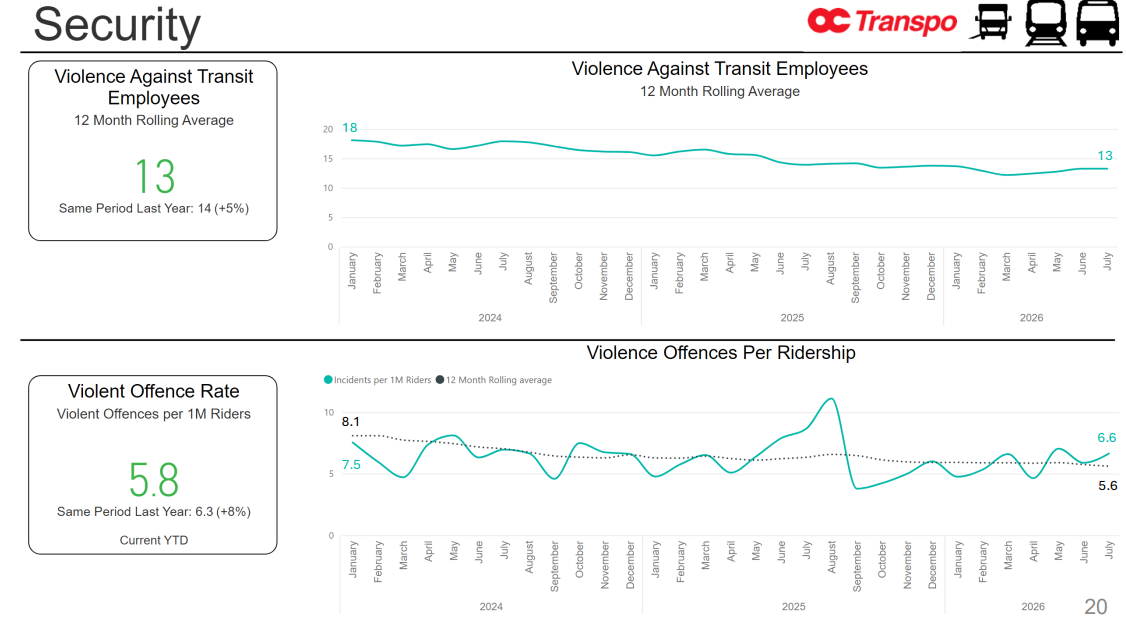
As usual, staff presented safety KPIs.
The commercial vehicle registration/CVOR violation rate is at 20%, which is a sharp increase from the low of 15% in June. The preventable collision frequency is 1.09/100,000 km, a slight increase from the summer and well above the target of 0.69. The customer injury rate was 1.06/million trips in 2026 and 0.5 in July, against a target of 1.04. 2026 has seen 124 time-off employee injuries so far, a decrease from 134 at this time last year.
The monthly average of violent offences against employees has fallen to 13, while the violent offence rate per million was 5.8, a decrease from 6.3 last year.
OC Transpo's safety reporting app is reportedly progressing well, and staff anticipate its launch this year.
Odds and Ends
Staff said in response to an inquiry from Marty Carr that there were two issues with OC Transpo's fare machines; one was from Metrolinx which owns and operates Presto; the other was with repeated U-Pass taps, which triggered a bug in the readers. Carr noted, referring to a previous inquiry about elevators, that "little things do add up" in rider perception of the system. The lost revenue from broken fare machines was an estimated $690,000-$960,000, which is about 0.2%-0.4% of all fare revenue over 18 months.
Relatedly, staff said that prepaid fare products make up the "majority" of fare revenue on OC Transpo; Presto e-purse tap are 19.8% of revenue, and debit cards another 10.1%.
The update included a map of where staff are located during peak periods, with bus supervisors and facilities maintenance staff positioned across the network, and rail supervisors and outreach staff concentrated on the rail lines.
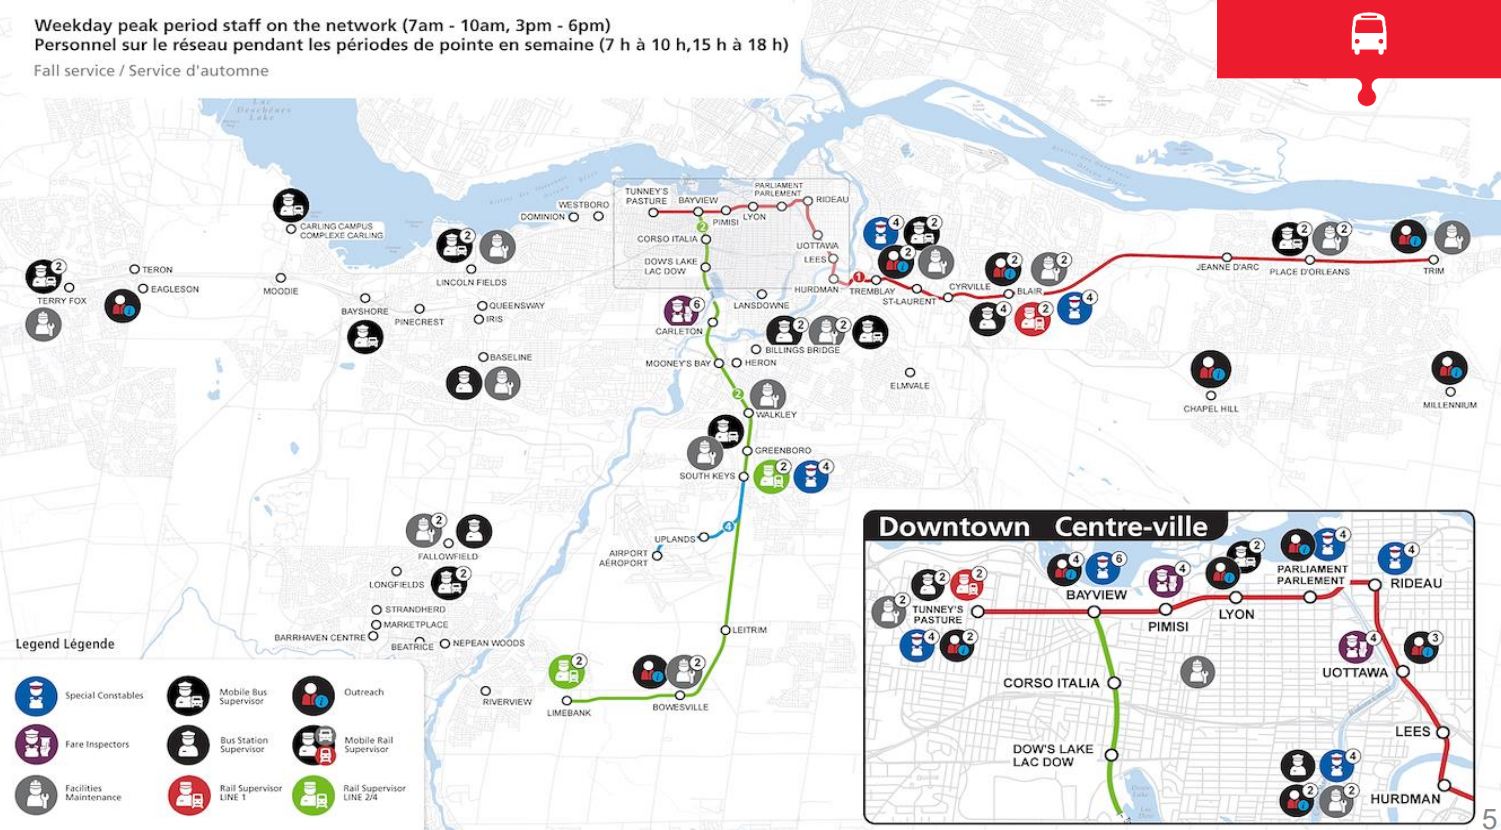
Staff talked about the non-fare revenue strategy, but given the paltry amount (under $1 million) raised by this strategy, this is missing the forest for the trees and is a waste of Transit Committee's time. It would be better positioned as a customer experience strategy, and cannot make up for Council's hesitation to clarify OC Transpo's future or raise the revenue needed to continue the status quo. They also talked about long-term partnerships and sponsorships for events; building institutional capacity for that may be more valuable than the revenue itself.
OC Transpo is in the midst of procurement of a new advertising contract. There is also a "vending machine pilot project" (why a pilot is needed for vending machines is unclear), with the machines installed at four stations with two more to come.
Leary confirmed that the introduction of on-demand service is progressing, but staff time is limited and focused elsewhere at the moment.
He plans to run about 3% of buses as extras, which would help vehicles recovery from major delays. They would be stationed at at major hubs and sent onto any run whose previous bus was unavailable for whatever reason.
Laura Dudas asked about ghost buses, buses which appear in the tracker until they don't. OC Transpo confirmed they plan to improve tracking systems to prevent their appearance, but resources are focused elsewhere at the moment and it is further down the priority list.
Staff plan to update Transit Committee on fare evasion at the next meeting. The last such update was in March.