
BUDGET 2003 – RECOMMENDED SOLUTIONS – 2003 TRANSIT FARES
Report to/Rapport au:
Transportation and Transit Committee/
Comité de transport & des services de transport en commun
and Council/et au Conseil
December 2, 2002/le 2 décembre 2002
Submitted by/Soumis par: R.T. Leclair, General Manager/Directrice générale,
Transportation, Utilities and Public Works/Transport, services et travaux publics
Contact/Personne-ressource: G. Diamond, Director/Directeur,
Transit Services/Service du transport en commun
842-3636 ext. 2271, gordon.diamond@transpo.ottawa.on.ca
| Ref N°: ACS2002-TUP-TRN-0014 |
SUBJECT: BUDGET 2003 – RECOMMENDED SOLUTIONS –
2003 TRANSIT FARES
OBJET: BUDGET 2003 – SOLUTIONS RECOMMANDÉES -
TARIFS DE TRANSPORT EN COMMUN 2003
REPORT RECOMMENDATION(S)
That the Transportation and Transit Committee recommend Council approve a 2% fare increase to be implemented on July 1, 2003, as shown in Exhibit 5.
RECOMMANDATION(S) DU RAPPORT
Que le Comité des transports et des services de transport en commun recommande au Conseil d’approuver une augmentation des tarifs de 2 p. 100 devant entrer en vigueur le 1er juillet 2003, ainsi que l’indique le document 5.
BACKGROUND
The 2003 Draft Operating Budget includes a recommendation to increase transit fares on July 1, 2003 by approximately 2%. This recommendation is in line with Council’s direction from December 18, 2001 to maintain fares adjusted to CPI. It is also consistent with the recommendation from the 1998 Comprehensive Review of OC Transpo Operations by KPMG to maintain transit fares constant in real terms.
The strategic direction for Ottawa’s transit fare system is to increase prepaid fares as far as possible. Prepaid fares cost less to process than cash and, more importantly, encourage transit use. The strategy to increase transit ridership is to encourage occasional riders to become frequent riders. This was the rationale for the ‘Deep Discount’ fare policy, which maintains a significant differential between cash and ticket prices while ensuring widespread access to tickets through nearly 400 vendors. This policy was introduced in 1998 and has been a positive factor in increased ridership.
DISCUSSION
Total passenger revenues in 2002 are projected to be $99.8 million. Total ridership will be approximately 86.7 million, which equates to an average fare of $1.15.
Current fares are shown in Exhibit 1, together with the revenue and ridership associated with each fare type. In terms of ridership, adult passes account for the highest percentage (33%) followed by student passes (28%). Tickets account for 19% of ridership and cash for 7%. Seniors passes account for 5% of ridership. The picture for revenues is rather different. While adult passes account for 34% of revenue, student passes account for 20%. Cash and tickets account for 13% and 26% of revenue, respectively.
Ottawa fares are compared with those in other cities in Exhibit 2. The 2001 average fare in Ottawa, at $1.13 is higher than Calgary at $0.95 and lower than Toronto at $1.50. The range of pass prices and cash and tickets varies from place to place. Where the information is available, 2003 fares are also shown in Exhibit 2. It should be noted that Gatineau’s new cash fare will be $2.75 from January 2003 and their tickets will be $2.20.
Transit fares in Ottawa over the last five years are shown in Exhibit 3. The chart shows that average fares in real terms have continuously decreased over the last four years. The large change from 1998 to 1999 was due to the influx of the Ottawa-Carleton District School Board High School students, when free yellow busing was withdrawn in the Urban Transit Area. The recommended fares for 2003 would still result in a slight decrease in the average fare in real terms.
Pass, ticket and cash sales are summarized in Exhibit 4 for the same period. This chart shows that adult and student pass sales have continued to grow in each of the last five years despite modest fare increases. Seniors’ passes dropped slightly in 2002.
In general, the long-term effect of a fare change is affected by the size of the increase or decrease with respect to inflation. However, if fares are maintained constant in real terms, there can be a short-term effect following a fare increase but there should not be a long-term impact on ridership. For price increases above CPI, elasticities ranging from –0.1 for express bus passes to –0.6, or more, for discretionary cash fare have been measured. However, the circumstances of each fare change, including how the different fare categories relate to each other and also the price of gas have an impact on how customers react. With gas prices continuing to remain high and increase periodically, a modest fare increase in line with the CPI should have little or no impact.
RECOMMENDATION
The recommended fare increases are shown in Exhibit 5. Overall, they amount to an increase of just less than 2% in average fare and would result in increased revenues of $900,000 in 2003, and $1.8 million in a full year.
It is recommended to hold ticket prices constant at $1.70, which would reduce the impact of increasing cash fares from $2.50 to $2.75. Adult passes would be increased by approximately 2%, in line with CPI, while student passes would be increased by about 1%. No increase is recommended for seniors passes.
This recommendation responds to the direction to maintain fares in line with CPI, while taking into account the pressures on particular groups discussed above.
A concern that has been raised in the past about increases in cash fares is that, because some OC Transpo pass and ticket vendors do not sell single tickets, this causes hardship for people of limited means. A sheet of 10 tickets, covering five rides, costs $8.50.
Currently, around 50% of OC Transpo vendors sell single tickets and we are committed to increasing this through a vendor education program in 2003. We know that there are some vendors where single tickets could not be sold without significant investment in point of sales cash registers, and so it is unlikely that we will be 100% successful. If we were to insist on single ticket sales at all vendors as a condition of selling OC Transpo passes and tickets, we would lose many of the larger vendors and impose a serious inconvenience on customers. Another approach to this issue would be to install ticket machines at high volume locations and this is also being explored for 2003.
In recent years, more and more students from the public school system have had their free yellow school buses withdrawn. This year, the Ottawa-Carleton District School Board withdrew yellow busing for grade 7 and 8 students inside the Urban Transit Area, affecting 1,800 students. This has transferred the financial burden to parents. Some families who have more than one student busing to school have expressed concern about the added cost.
Seniors are sensitive to price increases, since many of their trips are discretionary. They also travel largely in off-peak times and therefore cost less to serve than commuter trips. For the last three years, Seniors trips have remained relatively constant.
Keeping the price increase on Student passes well below CPI is recommended in view of the hardship that has been caused in some cases by the School Board’s withdrawal of free yellow busing. The recommended price freeze for Seniors’ passes recognizes the price-sensitivity of this market and will help to build ridership among seniors.
OTHER OPTIONS CONSIDERED
Two other options were considered in detail, which are summarized in Exhibits 6 and 7. The first was to have a 2% increase on all passes, including students and seniors, as well as a 10 cents increase on cash fares. This option would increase revenues by $760,000 in 2003. The other option developed in detail increased cash by 25 cents, increased adult passes by up to 2.35%, and did not increase Student or Seniors’ passes or tickets. This would increase revenues by $780,000 in 2003.
The first of these options is not recommended because it did not take into account senior citizens or the pressures on families with students and also fell short of the revenue increase target. The second option is similar to the recommended option but results in $120,000 less revenue in 2003.
CONSULTATION
Draft recommendations have been sent out to the Transit Subcommittee of the Mobility Issues Advisory Committee and will be discussed at a meeting on 9 December. Their comments will be submitted at the Transportation and Transit Committee meeting.
TRANSPORTATION MASTER PLAN
The Comprehensive Review, which supported the direction of the Transportation Master Plan to retain and attract transit ridership, supported the principle of adjusting transit fares in line with CPI on an annual basis.
FINANCIAL IMPLICATIONS
Subject to City Council approval, the 2003 base revenue budget of the Transit Services Branch of Transportation, Utilities and Public Works will be increased $901,000, as detailed in Exhibit 5. The 2003 Draft Operating Budget tabled with City Council includes this Recommended Solution on PXIX.
ATTACHMENTS
Exhibit 1 – Revenue and Ridership in 2002
Exhibit 2 – Actual and Proposed Fare Increases at Other Transit Properties
Exhibit 3 – Summary of Transit Fares
Exhibit 4 – Pass Sales, and Ticket & Cash Riders from 1998 to 2002
Exhibit 5 – Fare Scenario: Increase Passes, and Adult Cash Fares
Exhibit 6 – Passes Increased by Approximately 2% & Adult Cash Fare Increased by $0.10
Exhibit 7 – No Change in Senior & Student Passes & Adult Cash Fare Increased by $0.25
DISPOSITION
Fare increases, if approved, will be implemented on July 1, 2003.
EXHIBIT 1 Revenue and Ridership in 2002 | ||||
| ||||
Fare Type | Revenue | Percentage of Revenue | Ridership | Percentage of Ridership |
Cash | $ 13,057,288 | 13.1% | 5,852,411 | 6.8% |
Ticket | $ 25,709,794 | 25.8% | 16,156,345 | 18.6% |
Adult Passes | $ 34,025,190 | 34.1% | 28,478,031 | 32.8% |
Senior Passes | $ 2,313,987 | 2.3% | 4,143,808 | 4.8% |
Student Passes | $ 19,572,517 | 19.6% | 24,108,067 | 27.8% |
Other | $ 5,108,503 | 5.1% | 7,957,497 | 9.2% |
Total | $ 99,787,278 | 100.0% | 86,696,158 | 100.0% |
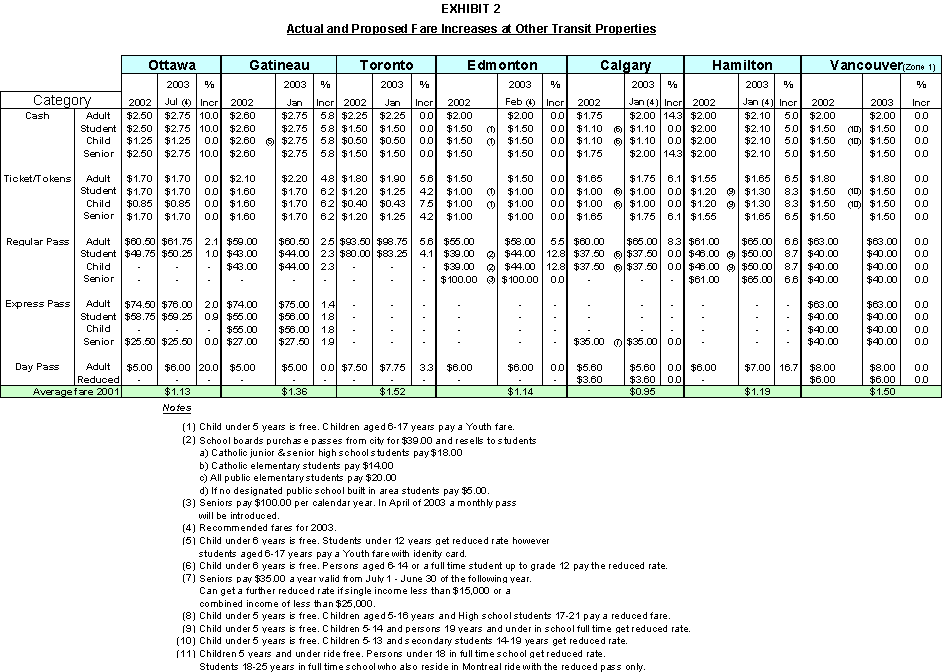
EXHIBIT 3 | ||||||
Summary of Transit Fares | ||||||
| | | | | | |
Category | 1998 | 1999 | 2000 | 2001 | 2002 | 2003 |
Cash Adult | $2.25 | $2.25 | $2.25 | $2.25 | $2.50 | $2.75 |
Cash Child | $1.25 | $1.25 | $1.25 | $1.25 | $1.25 | $1.25 |
Cash Express Route | $3.50 | $3.50 | $3.50 | $3.50 | $3.50 | $3.75 |
Cash Rural Express | - | - | - | - | $4.75 | $5.00 |
| | | | | | |
Ticket Adult | $1.50 | $1.50 | $1.60 | $1.70 | $1.70 | $1.70 |
Ticket Child | $0.75 | $0.75 | $0.80 | $0.85 | $0.85 | $0.85 |
Ticket Express Route | $2.25 | $2.25 | $2.40 | $2.55 | $2.55 | $2.55 |
Ticket Rural Express | - | - | - | - | $3.40 | $3.40 |
| | | | | | |
Regular Adult Pass | $57.00 | $57.00 | $58.50 | $59.50 | $60.50 | $61.75 |
Express Adult Pass | $72.50 | $72.50 | $72.50 | $73.50 | $74.50 | $76.00 |
| | | | | | |
Regular Student Pass | $46.75 | $46.75 | $47.75 | $48.75 | $49.75 | $50.25 |
Express Student Pass | $56.75 | $56.75 | $56.75 | $57.75 | $58.75 | $59.25 |
| | | | | | |
Express Rural Pass | N/A | N/A | N/A | N/A | $108.50 | $110.50 |
| | | | | | |
Senior Pass | $28.00 | $19.99 | $24.00 | $25.00 | $25.50 | $25.50 |
| | | | | | |
Day Pass | N/A | N/A | $5.00 | $5.00 | $5.00 | $6.00 |
| | | | | | |
Average Fare | 1.14 | 1.10 | 1.11 | 1.13 | 1.15 | 1.17 |
| | | | | | |
CPI (1971) | 433.60 | 442.00 | 455.10 | 469.70 | 481.40 | 492.50 |
| | | | | | |
Increase in CPI Over | | | | | | |
Previous year | - | 1.9% | 3.0% | 3.2% | 2.5% | 2.3% |
| | | | | | |
CPI Adjusted | | | | | | |
Average Fare ($1998) | 1.14 | 1.08 | 1.06 | 1.04 | 1.04 | 1.03 |
EXHIBIT 4 | |||||
Pass Sales, and Ticket & Cash Riders from 1998 to 2002 | |||||
| |||||
Fare Type | Pass Sales, & Ticket and Cash Sales from 1998 to 2002 | ||||
| 1998 | 1999 | 2000 | 2001 | 2002 |
Number of Adult Passes Sold | 470,516 | 463,553 | 495,980 | 562,658 | 576,589 |
Number of Student Passes Sold | 298,047 | 352,171 | 396,269 | 415,480 | 421,121 |
Number of Senior Passes Sold | 83,045 | 89,650 | 91,678 | 92,174 | 91,816 |
Number of Ticket Riders | 15,657,954 | 17,304,499 | 17,403,436 | 16,519,639 | 16,344,843 |
Number of Cash Fare Riders | 5,220,729 | 5,150,828 | 5,491,203 | 6,013,882 | 5,918,525 |
EXHIBIT 5
Fare Scenario: Increase Passes, and Adult Cash Fares
Fare Type | Approximate Number of Riders in 2002 | 2002 Base Fares | 2003 Recommended Fares | Fare Increase $ % | Increased Revenue | ||
Tickets | | | | | | | |
Regular | 12,739,133 | $ 1.70 | $ 1.70 | $0 | 0% | $0 | |
Express | 483,765 | $ 2.55 | $ 2.55 | $0 | 0% | $0 | |
Rural | N/A | $ 3.40 | $ 3.40 | $0 | 0% | $0 | |
Child | 2,902,588 | $ 0.85 | $ 0.85 | $0 | 0% | $0 | |
Cash | | | | | | | |
Regular | 4,657,318 | $ 2.50 | $ 2.75 | $0.25 | 10.00% | $ 423,000 | |
Express | 176,860 | $ 3.50 | $ 3.75 | $0.25 | 7.14% | $ 18,000 | |
Rural | N/A | $ 4.75 | $ 4.75 | $0 | 0% | $0 | |
Child | 1,061,161 | $ 1.25 | $ 1.25 | $0 | 0% | $0 | |
Adult Passes | | | | | | | |
Regular | 22,142,328 | $ 60.50 | $ 61.75 | $1.25 | 2.07% | $ 259,000 | |
Express | 6,294,012 | $ 74.50 | $ 76.00 | $1.50 | 2.01% | $ 95,000 | |
Rural | 335,098 | $ 108.50 | $ 110.50 | $2.00 | 1.84% | $ 3,000 | |
Daypass | 3,212,456 | $ 5.00 | $ 6.00 | $1.00 | 20.00% | $ 13,000 | |
Student & Senior Passes | | | | | | | |
Student Regular | 22,830,580 | $ 49.75 | $ 50.25 | $0.50 | 1.01% | $ 75,000 | |
Student Express | 1,270,952 | $ 58.75 | $ 59.25 | $0.50 | 0.85% | $ 3,000 | |
Student Rural | 58,013 | $ 92.75 | $ 92.75 | $0 | 0% | $0 | |
Student Annual Pass | 3,879,802 | $ 478.00 | $ 482.83 | $4.83 | 1.01% | $ 10,000 | |
Student Annual Express Pass | 490,677 | $ 564.00 | $ 568.79 | $4.79 | 0.85% | $ 2,000 | |
Seniors | 4,161,416 | $ 25.50 | $ 25.50 | $0 | 0% | $0 | |
| | | | | | | |
| Total | 86,696,158 | | | | Total | $ 901,000 |
Exhibit 6
Passes Increased by Approximately 2% & Adult Cash Fare Increased by $0.10
Fare Type | Existing Fare | Proposed Fare | Increase in Fare | % Increase in Fare | Increase in Revenue |
Adult Cash | $ 2.50 | $ 2.60 | $ 0.10 | 4.00% | $ 187,000 |
Adult Regular Pass | $ 60.50 | $ 61.75 | $ 1.25 | 2.07% | $ 259,000 |
Adult Express Pass | $ 74.50 | $ 76.00 | $ 1.50 | 2.01% | $ 95,000 |
Student Regular Pass | $ 49.75 | $ 50.75 | $ 1.00 | 2.01% | $ 180,000 |
Student Express Pass | $ 58.75 | $ 60.00 | $ 1.25 | 2.13% | $ 13,000 |
Senior Pass | $ 25.50 | $ 26.00 | $ 0.50 | 1.96% | $ 24,000 |
Tickets | $ 0.85 | $ 0.85 | $ - | 0.00% | $ - |
Rural Adult Express Pass | $ 108.50 | $ 110.50 | $ 2.00 | 1.84% | $ 3,000 |
| | | | Total: | $ 761,000 |
Exhibit 7
No Change in Senior & Student Passes & Adult Cash Fare Increased by $0.25
Fare Type | Existing Fare | Proposed Fare | Increase in Fare | % Increase in Fare | Increase in Revenue |
Adult Cash | $ 2.50 | $ 2.75 | $ 0.25 | 10.00% | $ 423,000 |
Adult Regular Pass | $ 60.50 | $ 61.75 | $ 1.25 | 2.07% | $ 259,000 |
Adult Express Pass | $ 74.50 | $ 76.00 | $ 1.50 | 2.01% | $ 95,000 |
Student Regular Pass | $ 49.75 | $ 49.75 | $ - | 0.00% | $ - |
Student Express Pass | $ 58.75 | $ 58.75 | $ - | 0.00% | $ - |
Senior Pass | $ 25.50 | $ 25.50 | $ - | 0.00% | $ - |
Tickets | $ 0.85 | $ 0.85 | $ - | 0.00% | $ - |
Rural Adult Express Pass | $ 108.50 | $ 110.50 | $ 2.00 | 1.84% | $ 3,000 |
| | | | Total: | $ 780,000 |